America's fastest-growing imports
Trade makes the world go round—and it also helped drive the exploration that proved the world isn't flat.
Besides that, it can strengthen bonds between nations, create more jobs, and expand economic opportunity. Trade has also played a major role in American history. One of the primary grievances set forth in the Declaration of Independence and one of the main reasons the colonies sought to establish their independence was Britain 's "cutting off our trade with all parts of the world." Unfettered trade with all countries remains the foundation of our current economic system.
In 2018, the United States spent $3.1 trillion on imports of both goods and services, making it the second-largest importer in the world after the EU. Over the last five years, from 2013–2018, total U.S. imports grew 12.1%. Of course, certain categories have contributed to that growth more than others. Which ones? Â鶹Դ´ tells you in this quick look at America's fastest-growing imports.
Using data from U.S. Census reports from 2013 through 2018, Â鶹Դ´ considered 98 commodity groups in order to come up with the 25 demonstrating the most growth. We've ranked them according to the highest percentage of growth over the past five years. From glass to fruit to fireworks, find out which commodities stand out as the top objects of Americans' wants and needs.
Since President Trump's first day in office, trade has been a hot-button issue. As long-standing trade deals are reworked and new sanctions added, trade with foreign countries is undergoing somewhat of an upheaval. The push for more domestically-produced goods means that this list could look wildly different in 2023.
You may also like:
#25. Glass and glassware
- 2013–2018 growth: 31.0%
- 2013 imports: $6.2 billion
- 2018 imports: $8.1 billion
Consumers around the world are becoming increasingly adamant about products and their packaging being environmentally friendly. For that reason, the production of glass and glassware has increased. While the U.S. is home to the biggest glass packaging manufacturer in the world, Europe remains the world's , thanks in part to cheaper labor rates.
#24. Wadding, felt, yarn, twine, ropes
- 2013–2018 growth: 31.3%
- 2013 imports: $1.8 billion
- 2018 imports: $2.4 billion
Over the last few years, the has begun a major push to increase domestic production of textiles. However, certain textiles such as wadding, felt, yarn, twine, and ropes remain among the fastest-growing American imports. As the NCTO continues to push for increased tariffs and changes in policy, it's likely that growth here may slow over the next several years.
#23. Vegetable plaiting materials
- 2013–2018 growth: 31.6%
- 2013 imports: $79.0 million
- 2018 imports: $104.0 million
refer to organic, environmentally friendly materials such as bamboo, rattan, reeds, rushes, and lime bark that can be used to make everything from furniture to fashion accessories. The U.S. lacks the climate to grow many of these products domestically, forcing the country to look elsewhere for these materials.
#22. Base metals, cermet, and related articles
- 2013–2018 growth: 31.7%
- 2013 imports: $2.4 billion
- 2018 imports: $3.1 billion
Base metals are metals that aren't considered precious (i.e. copper and tin), while cermets are often used for electrical components and machine tools. Base metals are commonly used in renewable energy solutions, and as Americans have sought to implement many of these in order to lower their carbon footprint, it makes sense that the demand for imports would increase.
#21. Milling products: malt, starch, inulin, wheat gluten
- 2013–2018 growth: 32.4%
- 2013 imports: $1.4 billion
- 2018 imports: $1.9 billion
America imports the processed, or milled, versions of many of the crops it exports. For example, European malt—barley that has been steeped, germinated and dried—is cheaper and better suited for beer brewing than its American alternative. That fact has motivated many to import their malt from Germany and other European countries, thereby increasing the overall demand for milled products.
#20. Railway or tramway stock, traffic signal equipment
- 2013–2018 growth: 32.8%
- 2013 imports: $1.6 billion
- 2018 imports: $2.1 billion
Railway and tramway stock refers to the vehicles that move on tracks (i.e. the train cars or tram cars themselves). America is a late adopter of the high-speed railway or tramway, falling behind countries like Japan, which are already connected by high-speed trains. But of several high-speed train routes between major U.S. cities likely explains the dramatic increase in imports in this category over the past five years.
#19. Art of stone, plaster, cement, asbestos, mica
- 2013–2018 growth: 33.4%
- 2013 imports: $6.2 billion
- 2018 imports: $8.3 billion
While the National Endowment for the Arts claims there are more than 2 million people in the country whose primary job is “artist,” fine artists make up an incredibly small percentage of that. As a result, art made out of stone, plaster, cement, asbestos, and mica is one of America's fastest-growing imports—and will probably remain so, until a better way can be found to fairly compensate more fine artists.
#18. Plastics and related articles
- 2013–2018 growth: 33.6%
- 2013 imports: $44.2 billion
- 2018 imports: $59.1 billion
The majority of American plastic imports—yogurt containers, bottles, egg cartons, etc.—wind up in the trash. In the past, the vast majority of this plastic was exported to China, which processed and regurgitated it as raw materials. However, beginning in 2018, it would no longer be accepting the plastic trash. Now, this growing import is being shipped to other countries that don't have the capacity to deal with it, leaving many to wonder what will happen to plastic trash in the years ahead.
#17. Prep feathers, down, artificial flowers, and hair art
- 2013–2018 growth: 34.4%
- 2013 imports: $1.8 billion
- 2018 imports: $2.4 billion
The bulk of the world's artificial flower supply is made in China's Guangdong Province. The cheap labor found in such areas is likely the main reason the U.S. imports prep feathers, down, artificial flowers, and hair rather than producing those items itself.
#16. Headgear
- 2013–2018 growth: 34.7%
- 2013 imports: $1.9 billion
- 2018 imports: $2.6 billion
Headgear refers to hats and caps (not the orthodontic tooth toppers), and the main exporter once again is China. The U.S., meanwhile, is the biggest importer of various headgear. This is just one of many imports that could be impacted by the between the two countries, which are expected to wrap up shortly.
#15. Special import provisions not elsewhere specified or included
- 2013–2018 growth: 35.8%
- 2013 imports: $13.4 billion
- 2018 imports: $18.3 billion
“Special import provisions not elsewhere specified or included” is essentially a miscellaneous category. Made up of hundreds, if not thousands, of items that don't fit neatly into any of the other 98 commodity groups, this category accounts for a significant portion of America's overall worth of imports.
#14. Essential oils, perfumery, cosmetics
- 2013–2018 growth: 39.8%
- 2013 imports: $10.6 billion
- 2018 imports: $14.8 billion
It's no secret that Americans are obsessed with their appearance, so it's also no surprise that the U.S. is of cosmetics and other beauty products. As the push for gains momentum, it's possible that growth in this category could slow over the next five years.
#13. Wood and articles of wood, wood charcoal
- 2013–2018 growth: 40.6%
- 2013 imports: $15.2 billion
- 2018 imports: $21.4 billion
The reports that roughly one-third of the lumber used in the U.S. last year was imported. Nearly all of that lumber came from Canada. While the U.S. produces a large amount of lumber itself, much of it is sold overseas, where it can fetch a higher premium.
#12. Furniture, bedding, lamps
- 2013–2018 growth: 40.9%
- 2013 imports: $47.7 billion
- 2018 imports: $67.1 billion
Once the of America, North Carolina and Virginia are now facing the same fate as former manufacturing cities like Detroit. Imports from other countries are simply too cheap for the once-bustling factories in those states to keep their doors open. Now, the vast majority of items Americans sit and eat upon come from Asia, especially China.
#11. Meat and edible offal
- 2013–2018 growth: 41.4%
- 2013 imports: $5.8 billion
- 2018 imports: $8.3 billion
For the less adventurous eater, edible offal refers to the internal organs and entrails of a butchered animal. The U.S. imports much of this—and other, more standard cuts of meat—in order to of domestic consumers. Controversially, much of this imported meat is actually labeled "" when sold in stores, something the USDA is currently working to change.
#10. Carpets and other textile floor coverings
- 2013–2018 growth: 42.8%
- 2013 imports: $2.2 billion
- 2018 imports: $3.1 billion
Much of America's is headquartered in one state (Georgia) and has been struggling to stay afloat since the 1950–1960s. As with many other items on this list, carpets and textile floor coverings can be made abroad more cheaply because of low-cost foreign labor. However, current (where many rugs come from) have slowed if not stopped these imports, and could end up changing the face of the industry.
#9. Explosives, pyrotechnics, matches
- 2013–2018 growth: 43.1%
- 2013 imports: $650.2 million
- 2018 imports: $930.1 million
One man named controls roughly 70% of the fireworks imported into the United States. While business for him is booming, many American suppliers worry that his monopoly could cost them access to their wares. His control has driven prices up overall, causing many to wonder if the Fourth of July staple is a thing of the past.
#8. Salt, sulfur, earth and stone, lime and cement plaster
- 2013–2018 growth: 43.2%
- 2013 imports: $2.8 billion
- 2018 imports: $4.0 billion
Importing dirt (or earth) may seem strange and unnecessary to most people, but we're actually facing enough of that it's necessary. Good, fertile, nutrient-filled soil—and lots of it—is necessary to grow the abundance of crops we rely on, but it takes hundreds of years to grow back an inch or two of usable topsoil. Our solution has been to import the soil from other countries in order to continue our level of crop production.
#7. Prep cereal, flour, starch or milk, bakers wares
- 2013–2018 growth: 44.6%
- 2013 imports: $5.5 billion
- 2018 imports: $7.9 billion
Like milling products, “prep cereal, flour, starch, milk, and bakers wares” are growing as an import category most likely because they are cheaper to process overseas. The size of the factories necessary to process these things, as well as the manpower required, would make for a much more expensive operation in this country than in other places abroad.
#6. Special classification provisions not elsewhere specified or included
- 2013–2018 growth: 46.2%
- 2013 imports: $56.5 billion
- 2018 imports: $82.6 billion
An interesting import label, "special classification provisions not elsewhere specified or included" generally covers: goods with U.S. origins that are temporarily returned for repairs or goods with components that came from the U.S.. One example would be a faucet welded together outside of America, but with at least one piece that originated there, being sent back for sale in this country.
#5. Aluminum and related articles
- 2013–2018 growth: 54.0%
- 2013 imports: $15.3 billion
- 2018 imports: $23.5 billion
President Trump on imported aluminum in 2018 in an effort to bolster the domestic industry. While the jury is out on whether this move actually created more jobs in the long run, one thing is certain: We can't expect this type of growth in aluminum imports over the next five years.
#4. Zinc and related articles
- 2013–2018 growth: 55.3%
- 2013 imports: $1.7 billion
- 2018 imports: $2.6 billion
One of the fastest-growing American imports, zinc is set to skyrocket in cost this year. In mid-March, warehouses held worth of global consumption of the metal. Additionally, China is the of zinc, which may also affect the amount of growth we see in this category in the years to come.
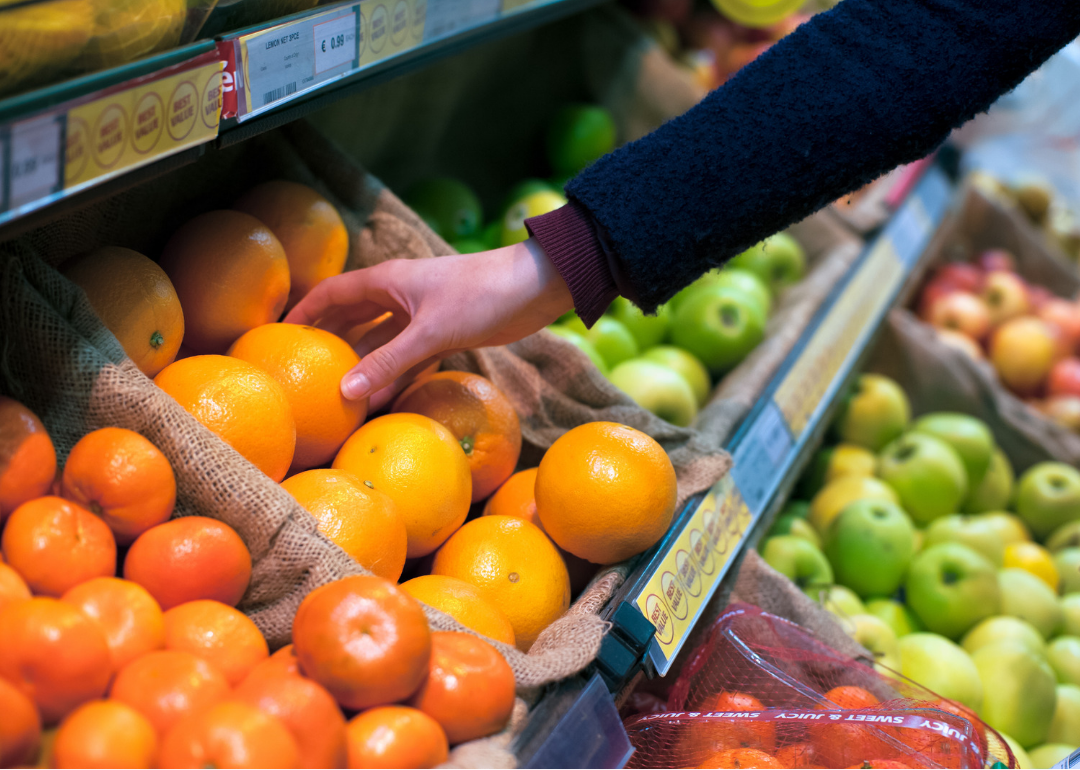
#3. Edible fruit and nuts, citrus fruit, and melon peel
- 2013–2018 growth: 55.6%
- 2013 imports: $11.2 billion
- 2018 imports: $17.4 billion
As of 2018, the fruit sold in America came from other countries. This trend seems likely to continue. Increased year-round demand from American consumers, relaxed import rules, and cheaper overseas labor are all major factors that explain why so much of the produce is imported.
#2. Pharmaceutical products
- 2013–2018 growth: 83.9%
- 2013 imports: $62.9 billion
- 2018 imports: $115.7 billion
One of President Trump's when he took office was to bring more drug and pharmaceutical production stateside. While about 75% of our drugs are already produced in the country, we were, at the time, spending about $86 billion on imported drugs, making us the largest importer of pharmaceuticals in the world. Today more drugs are being made in the U.S., but our use , meaning that the amount imported has grown, not shrunk.
#1. Miscellaneous edible preparations
- 2013–2018 growth: 87.1%
- 2013 imports: $4.1 billion
- 2018 imports: $7.8 billion
The fastest-growing American import? Miscellaneous edible preparations. Think of the foreign foods aisle at your local grocery store—chances are it's stocked with a variety of options from countries all over the world, a smorgasbord that reflects the $7.8 billion spent on these items in the last year alone. The increase in this category demonstrates just how multicultural and global America is.


