Cost of oil the year you were born
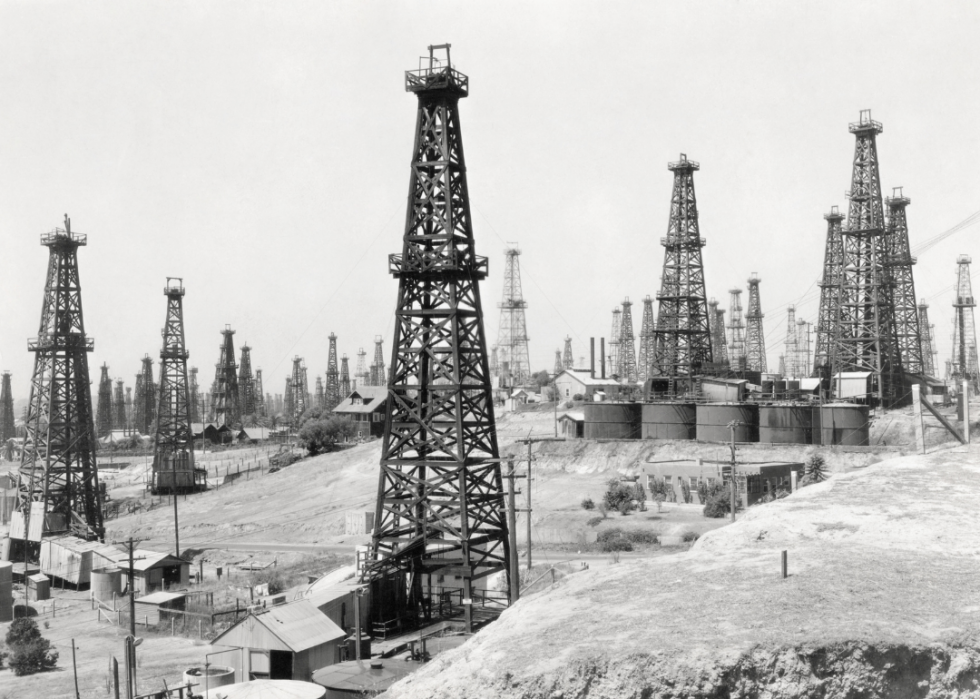
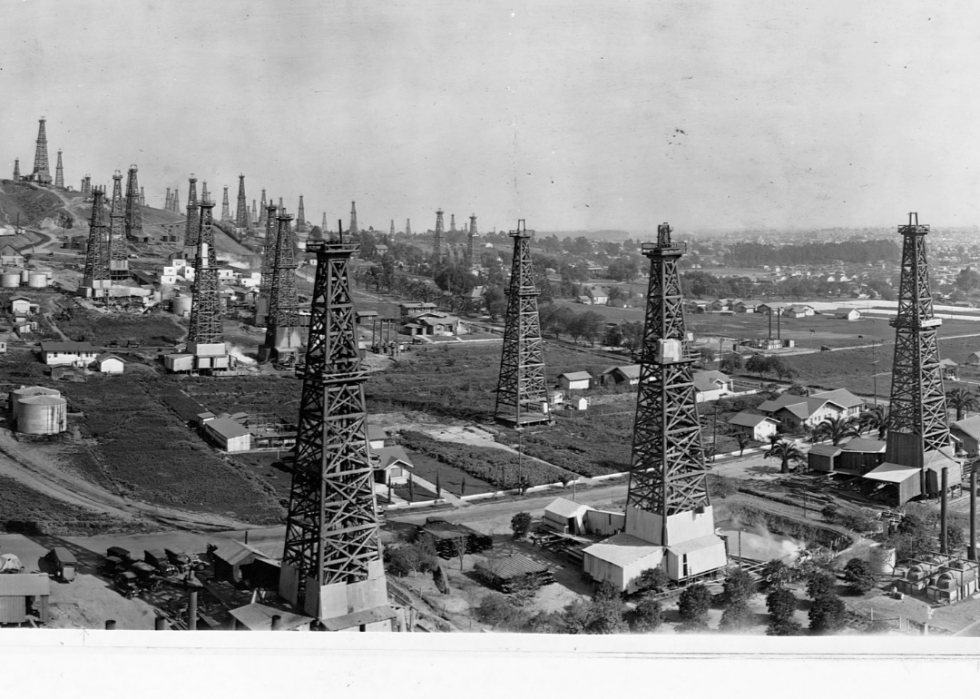
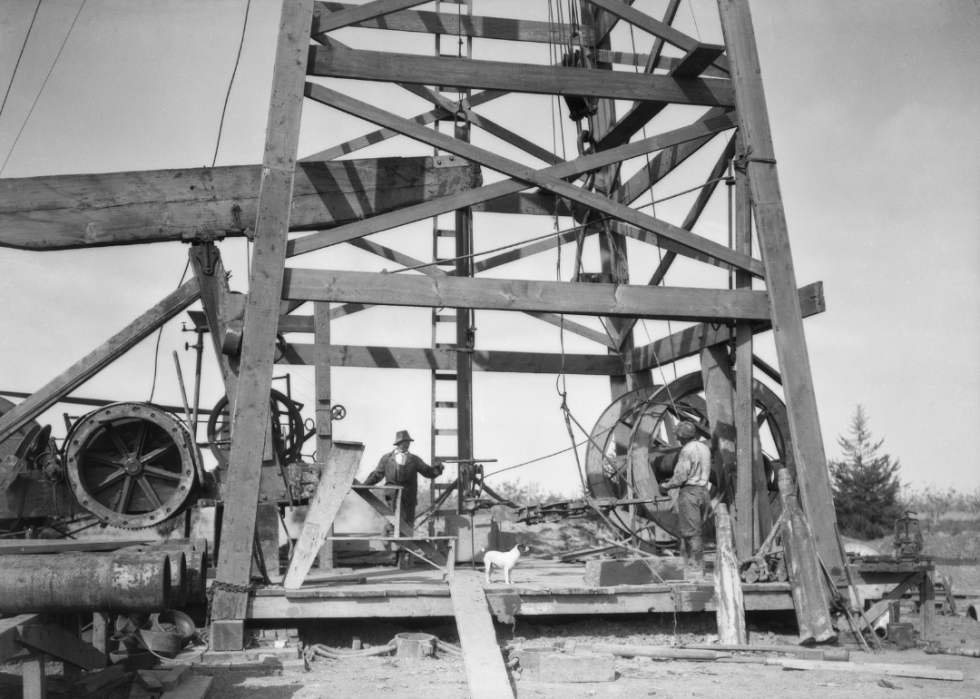
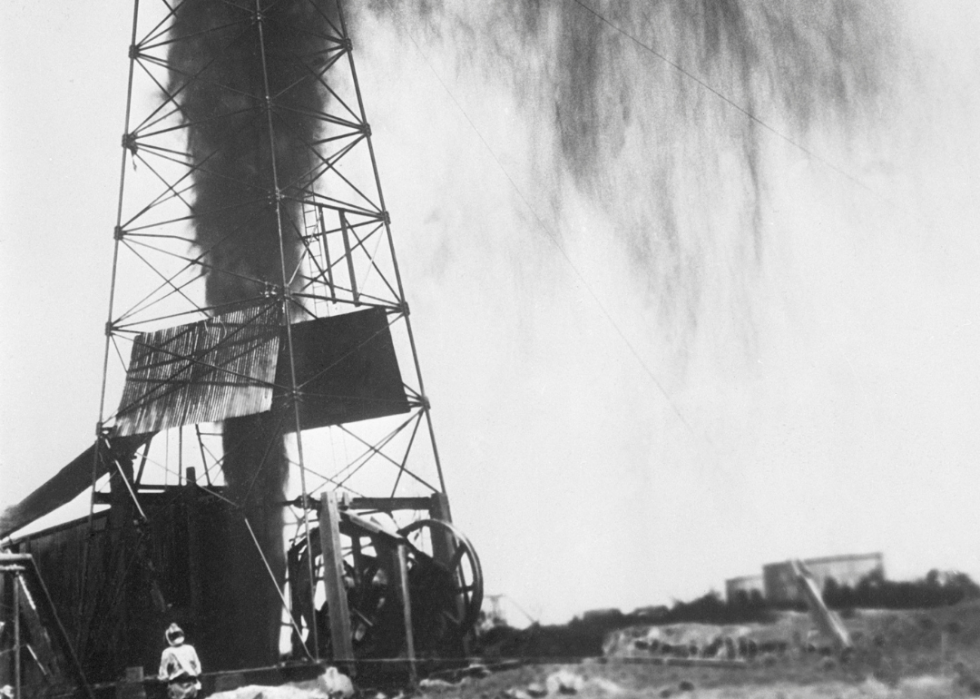
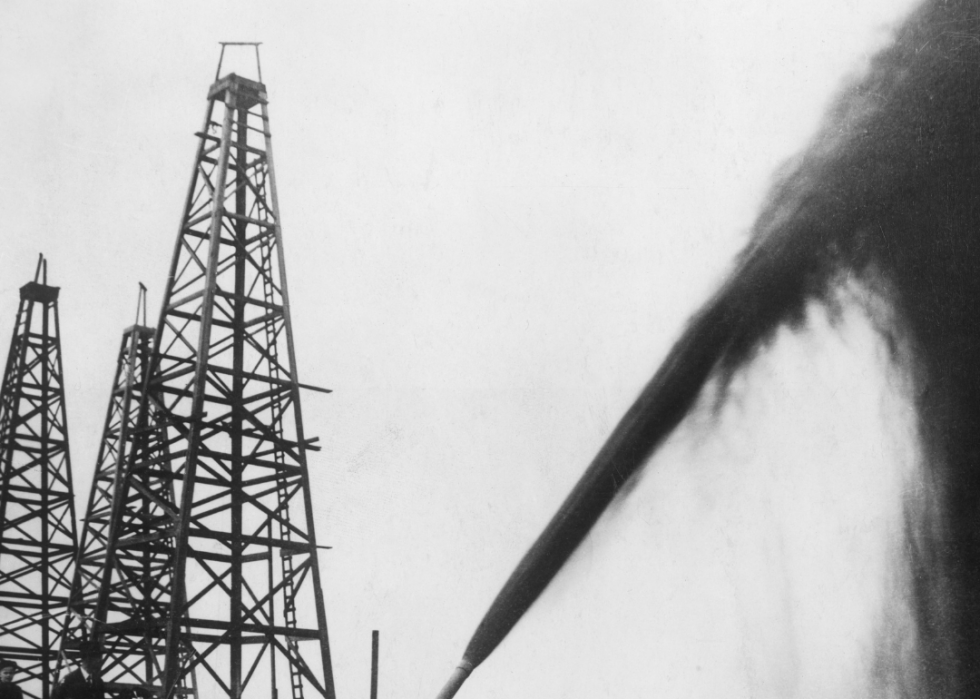
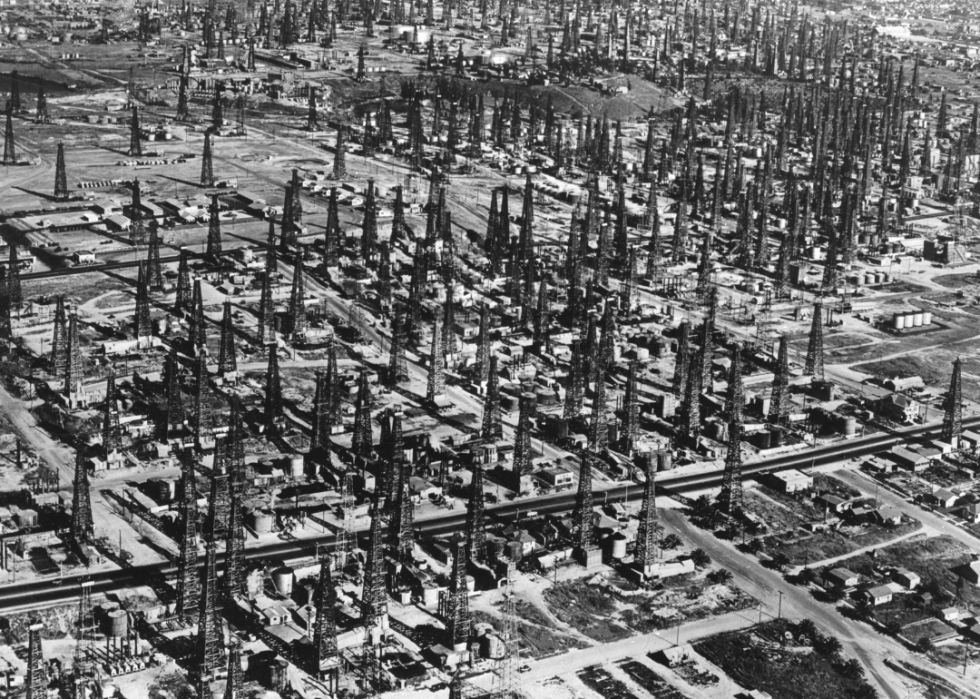
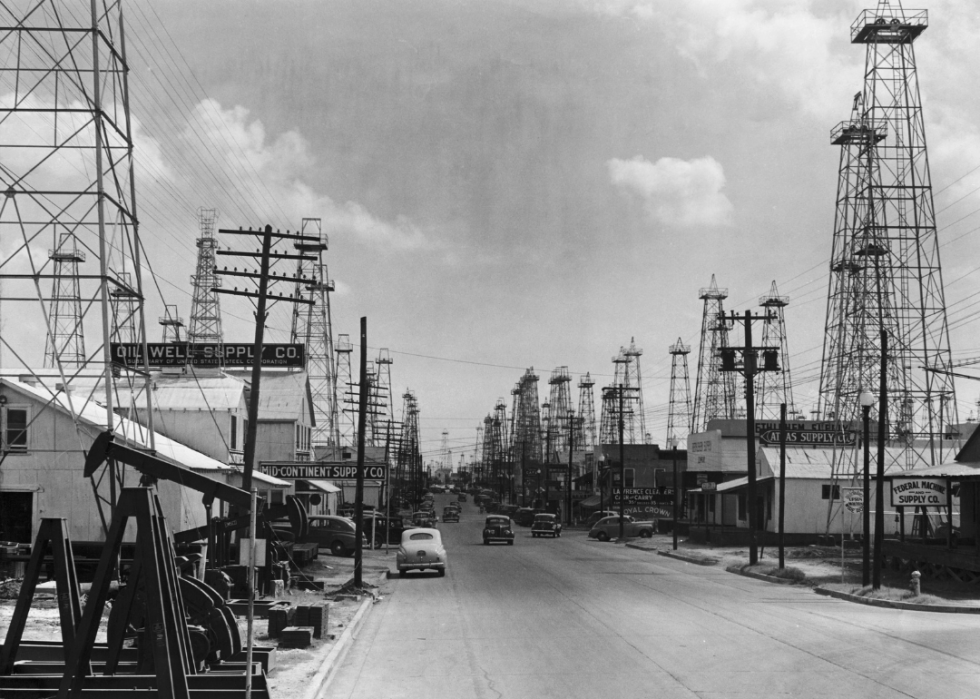
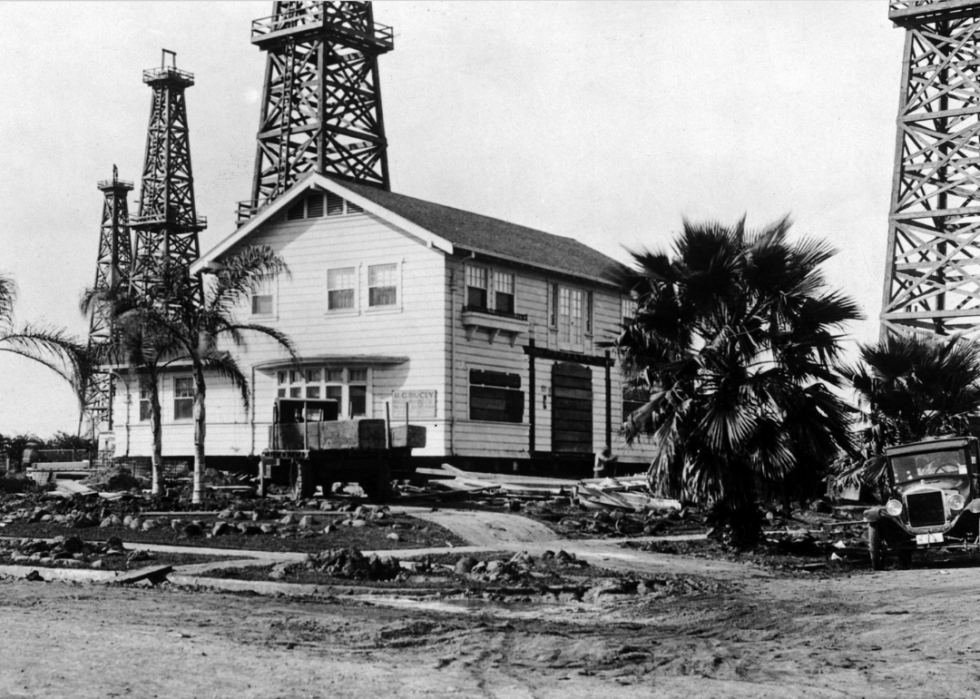
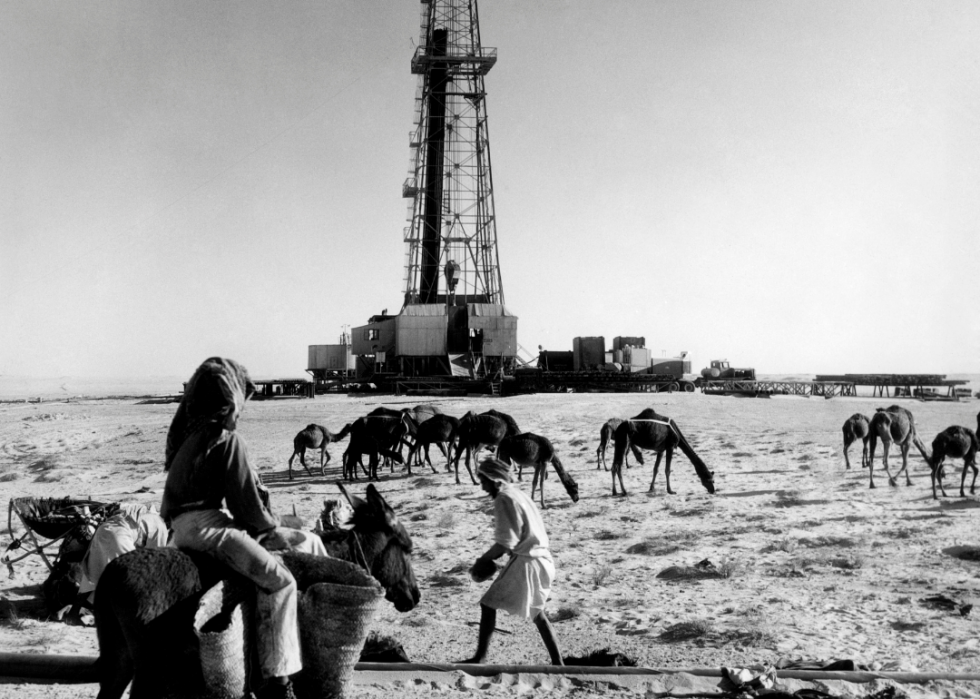
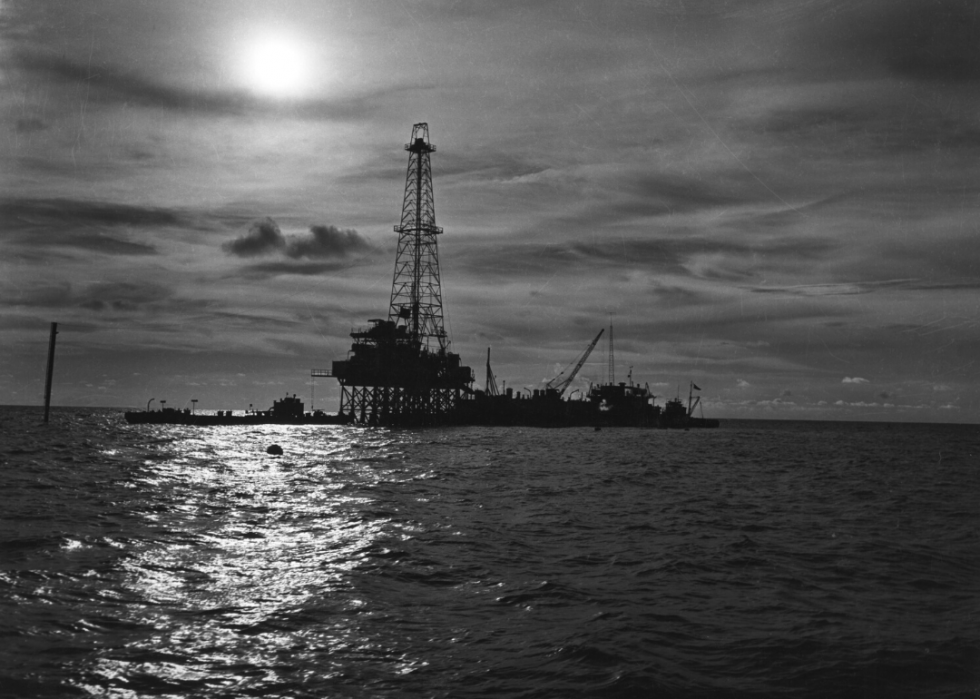
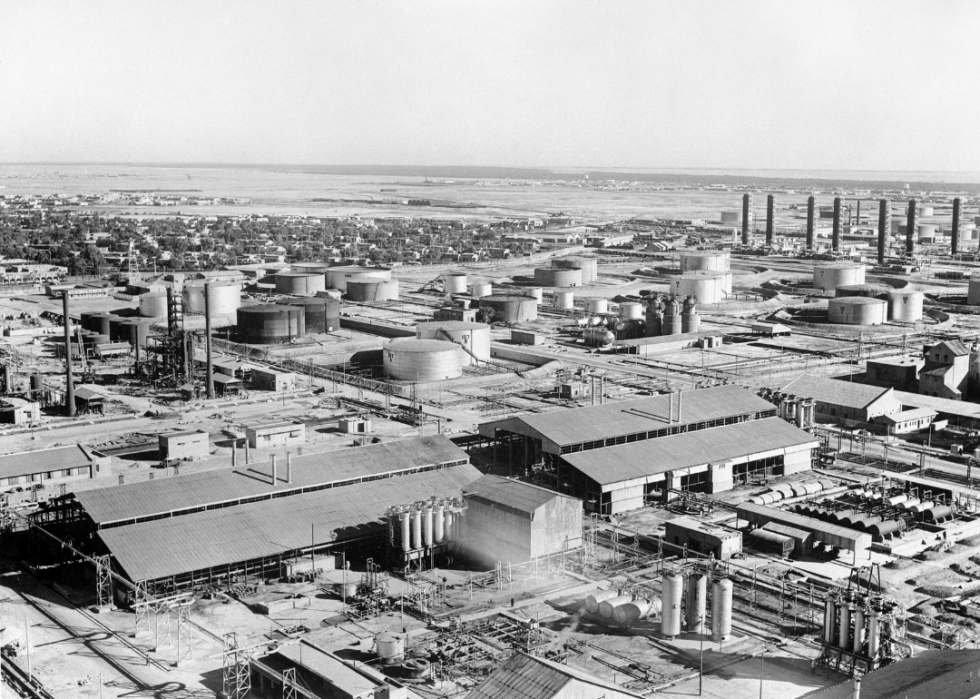
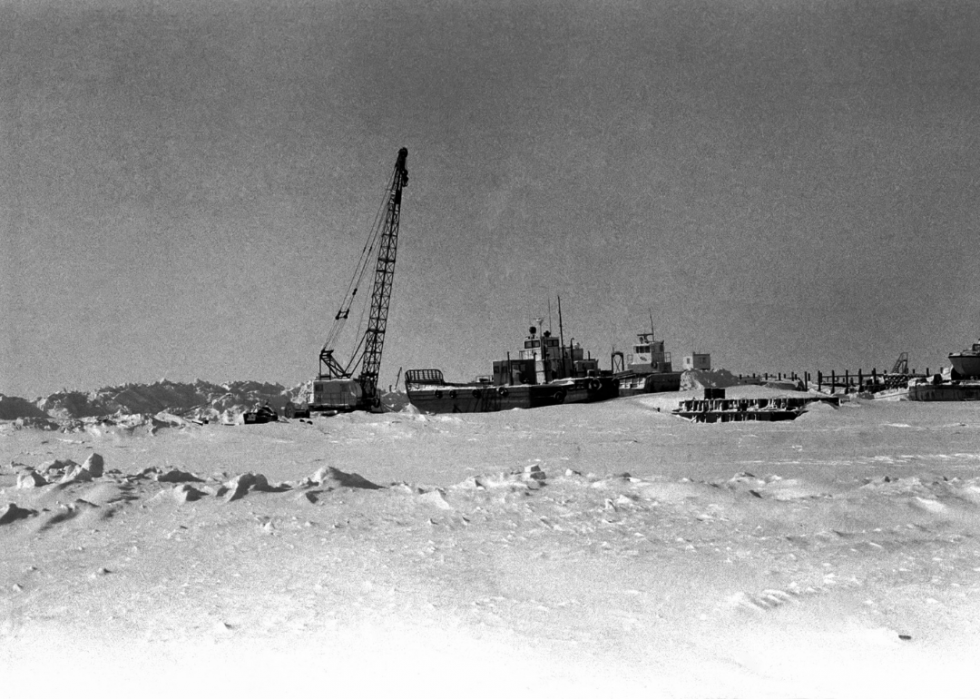
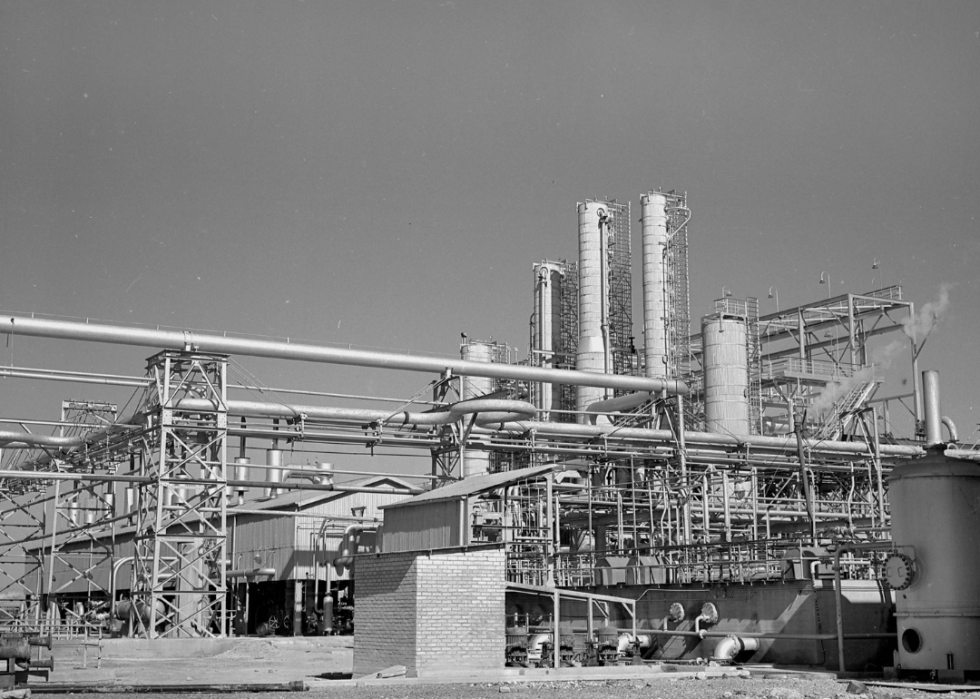
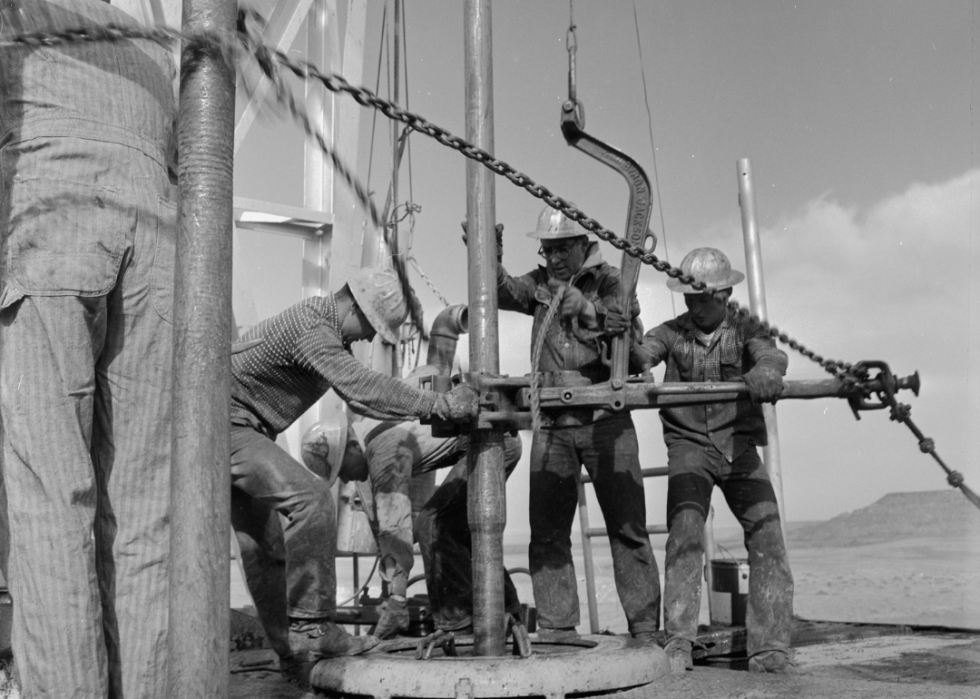
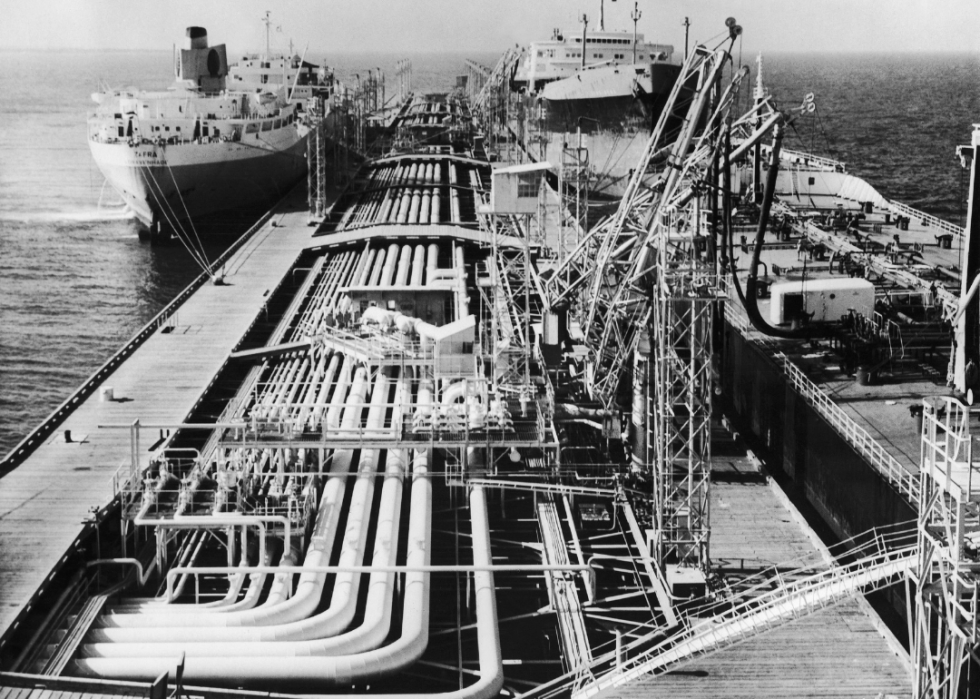
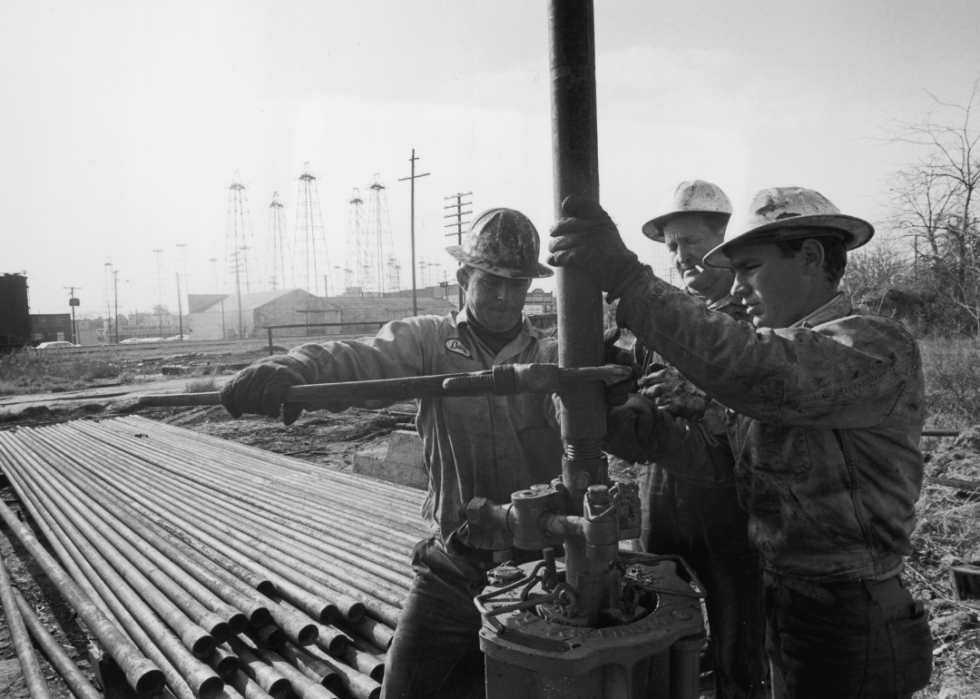
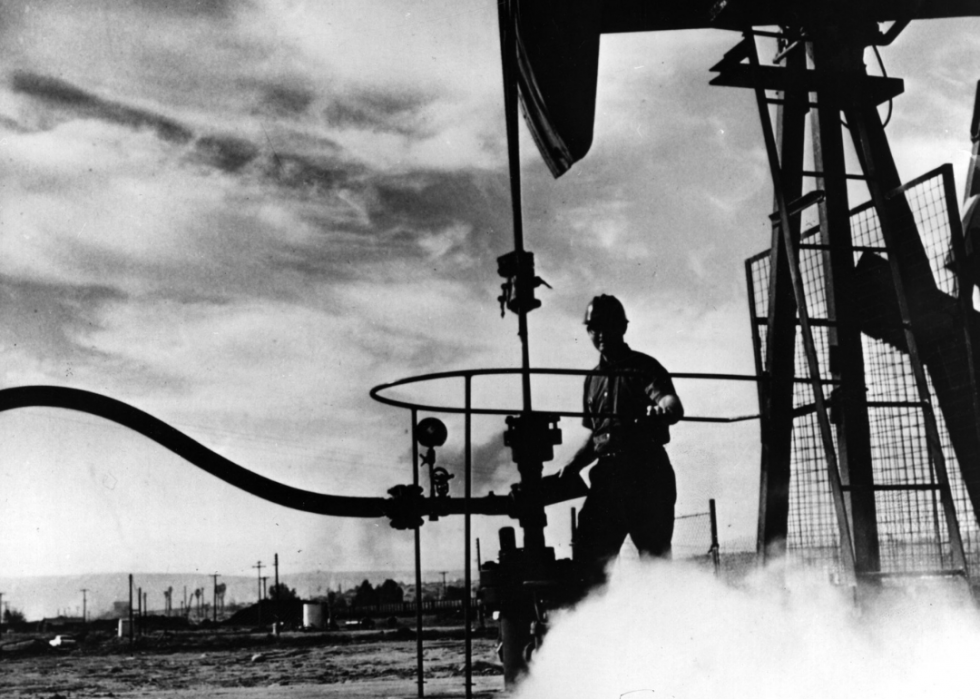
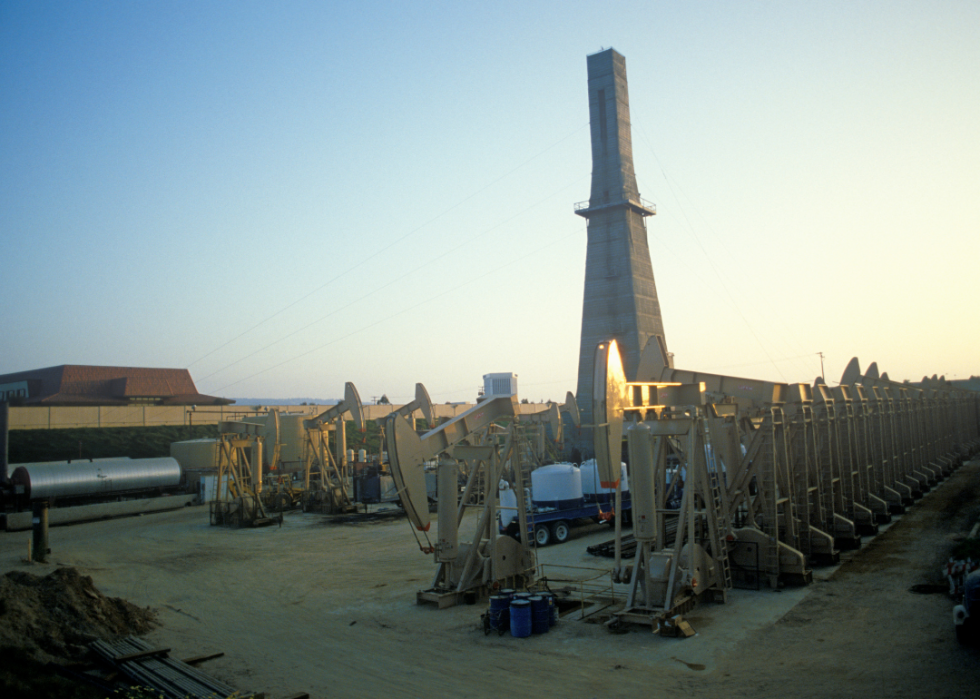
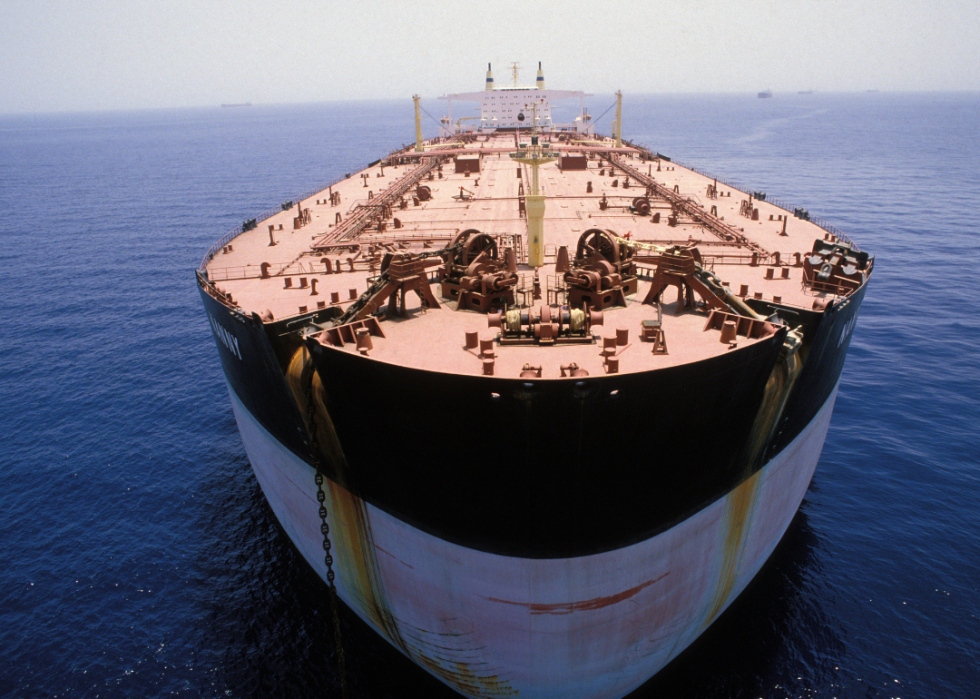
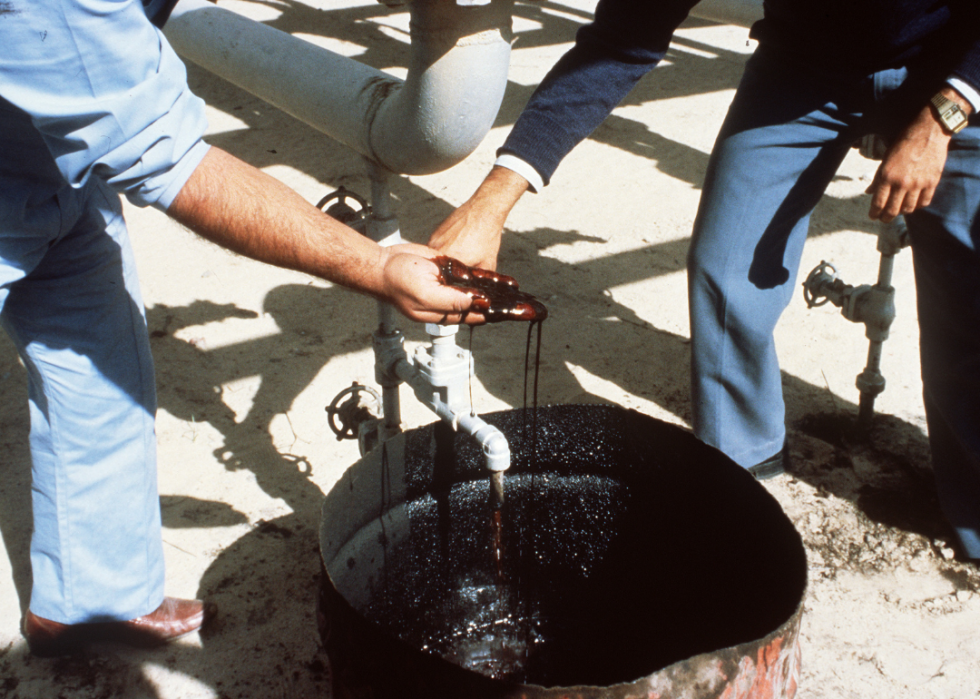
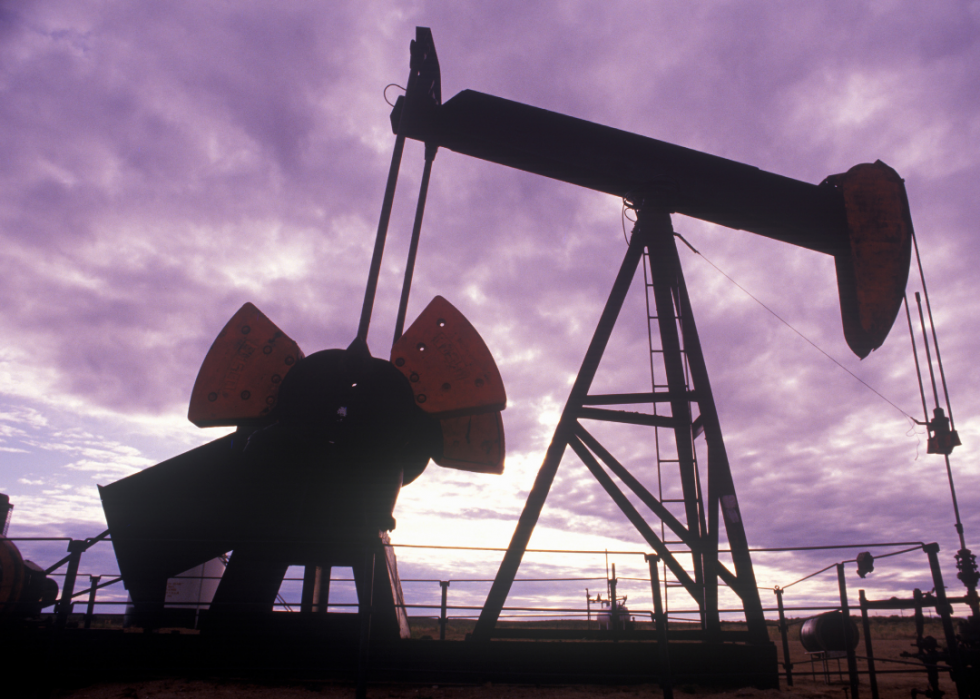
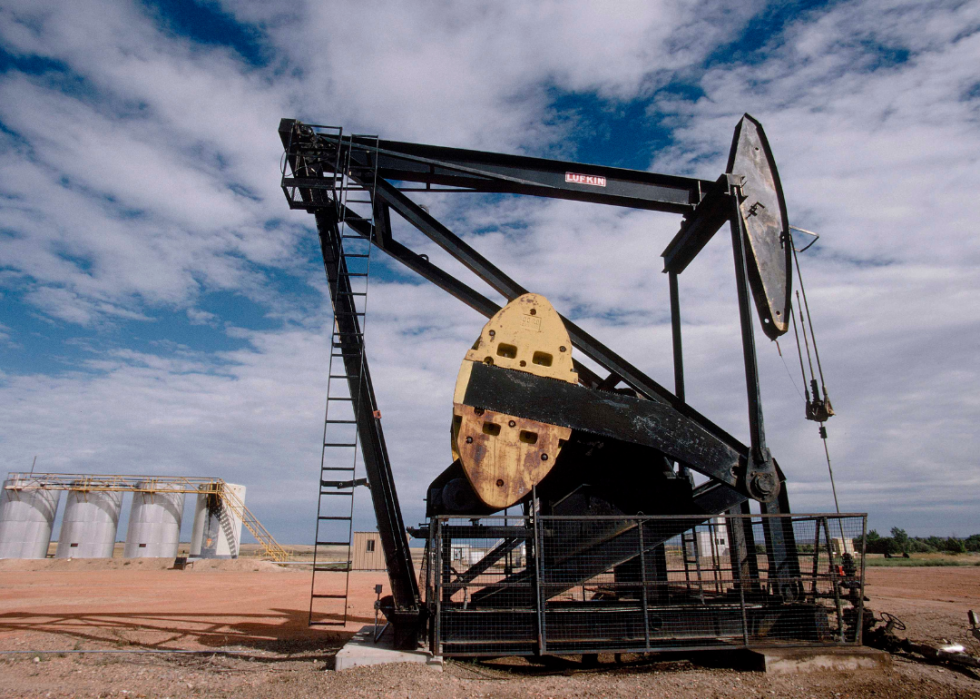
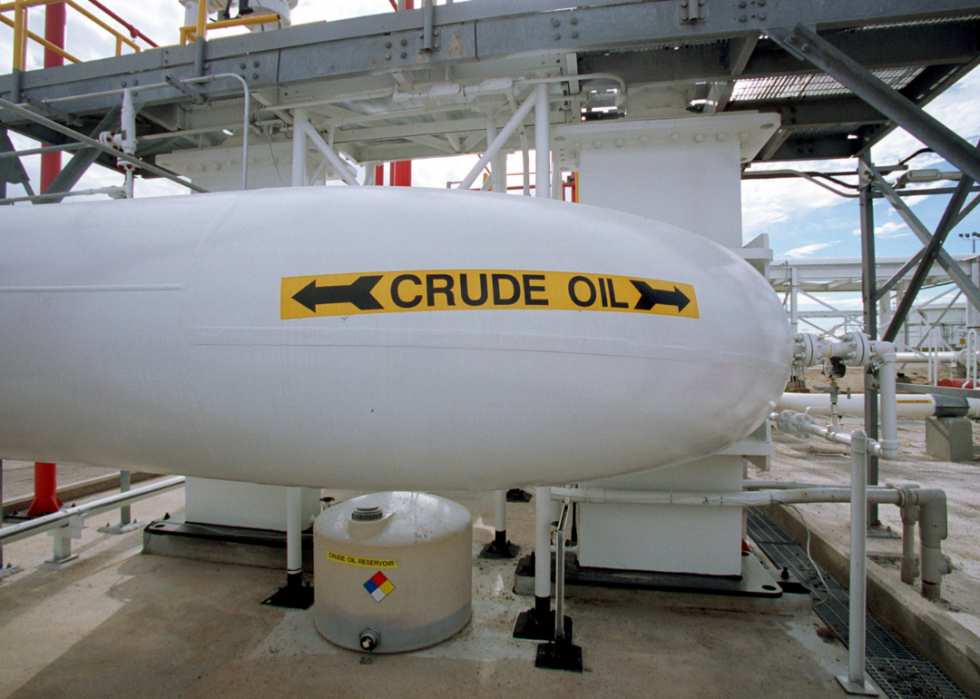
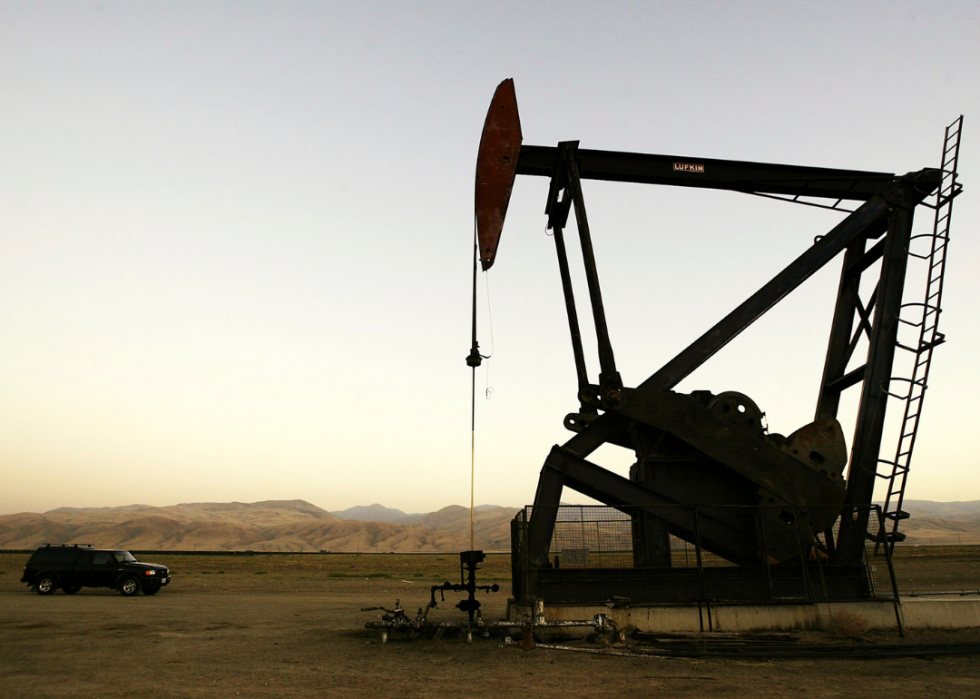
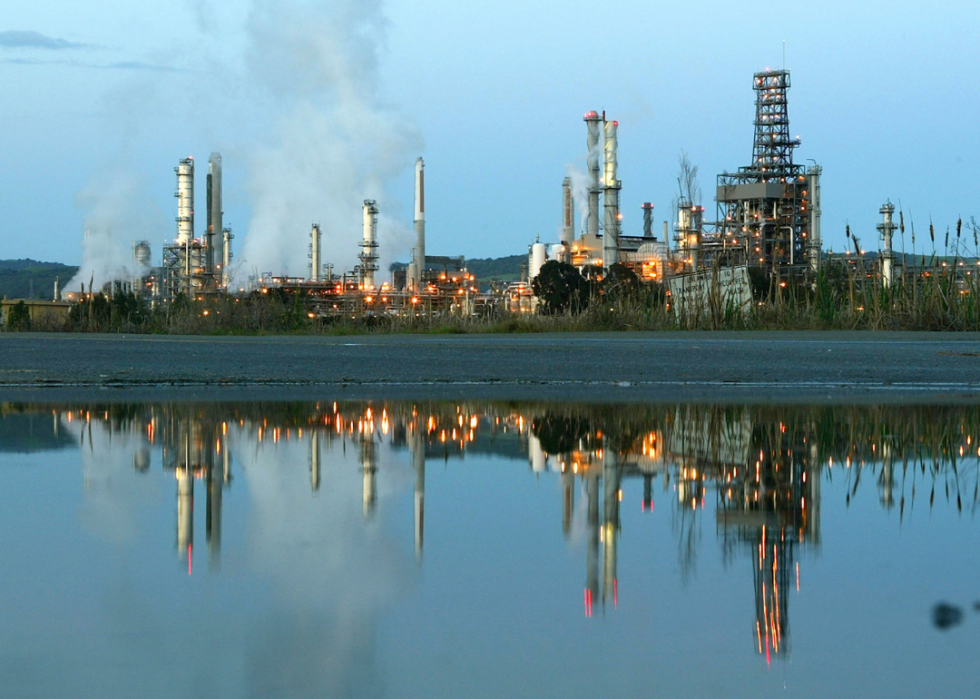
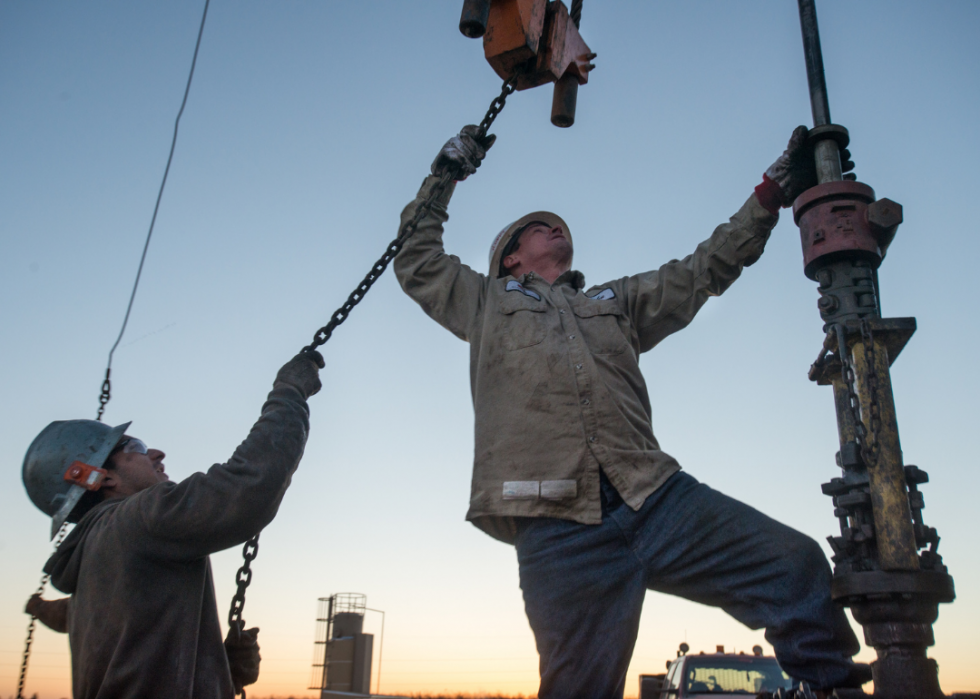
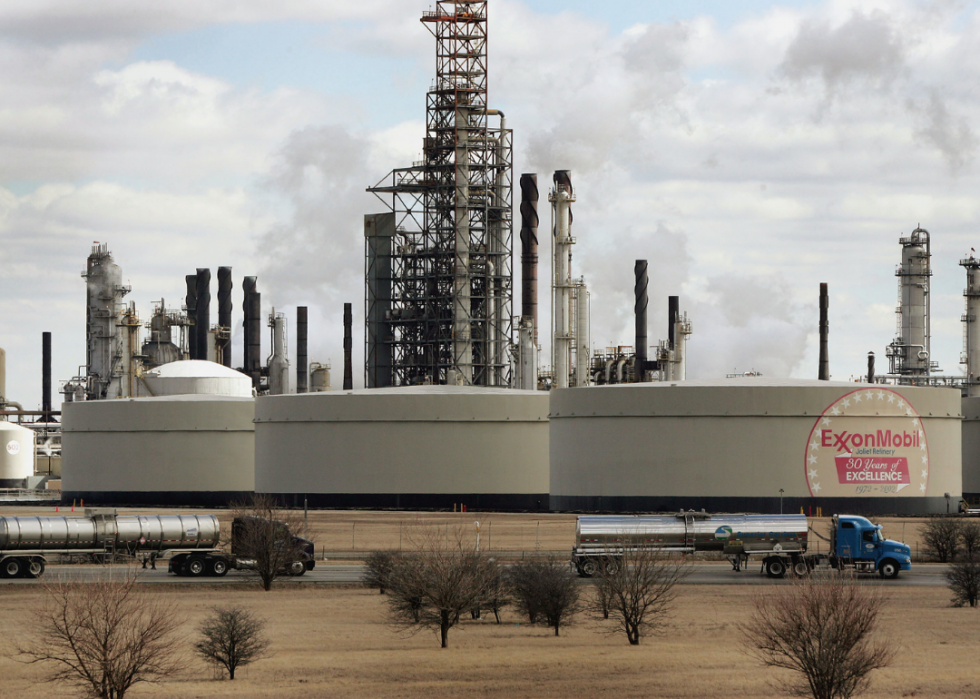
The Industrial Revolution of the 1800s saw the rise of oil as the foremost energy source for powering the world's new machines. The by the turn of the 20th century, as major discoveries in Texas helped push outputs above 64 million barrels per year. Despite today's emissions standards and alternative fuel sources, the use of crude oil peaked at worldwide in 2019.
To look deeper down the well of what major discoveries, technologies, and world events affected the price of oil the year you were born, Âé¶¹Ô´´ sourced the price of oil since 1920 from the . Prices have been inflation-adjusted by CPI from the . Oil production data are from , while the data for two of the world's largest producers, Saudi Arabia and Venezuela, was available starting in 1965.
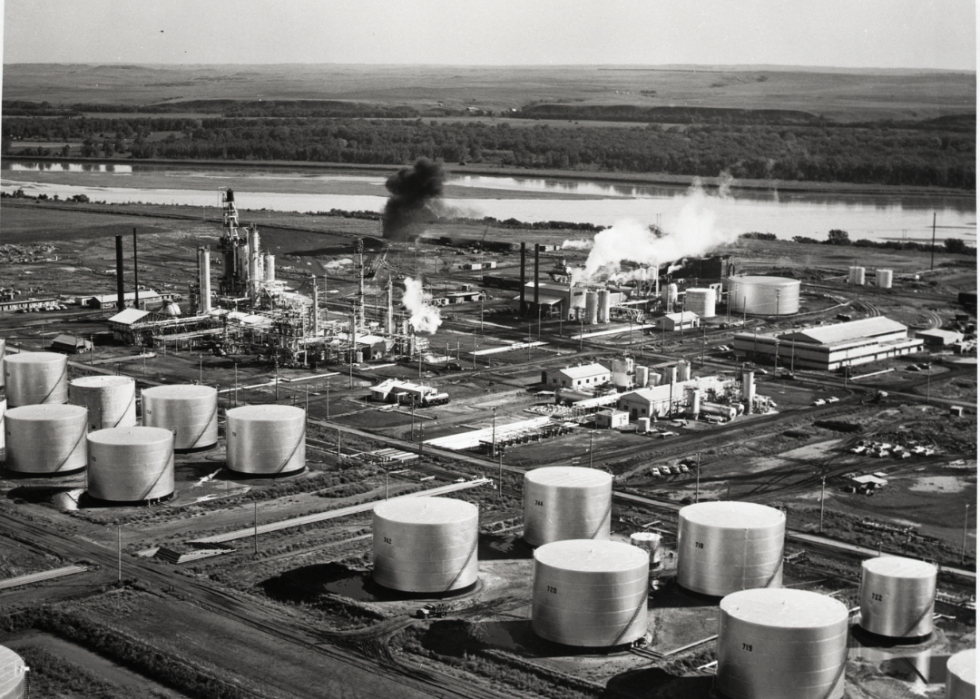
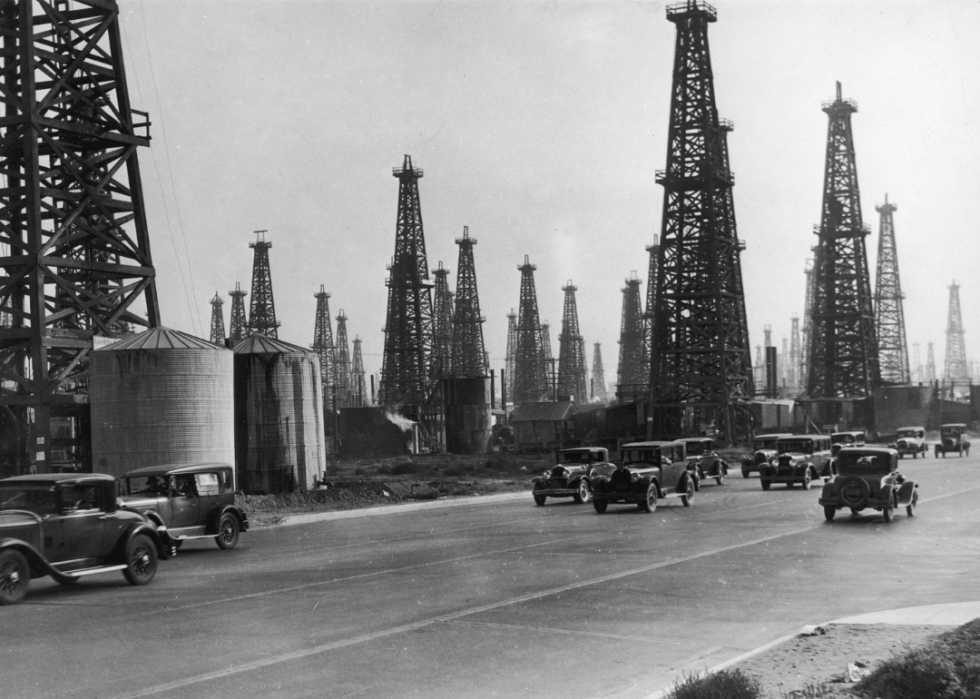
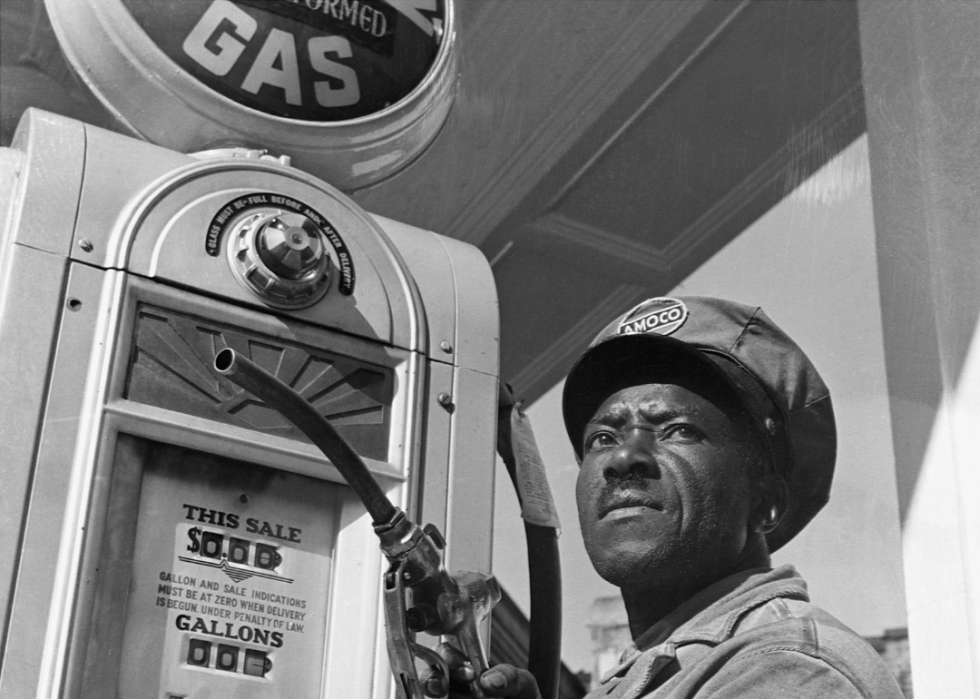
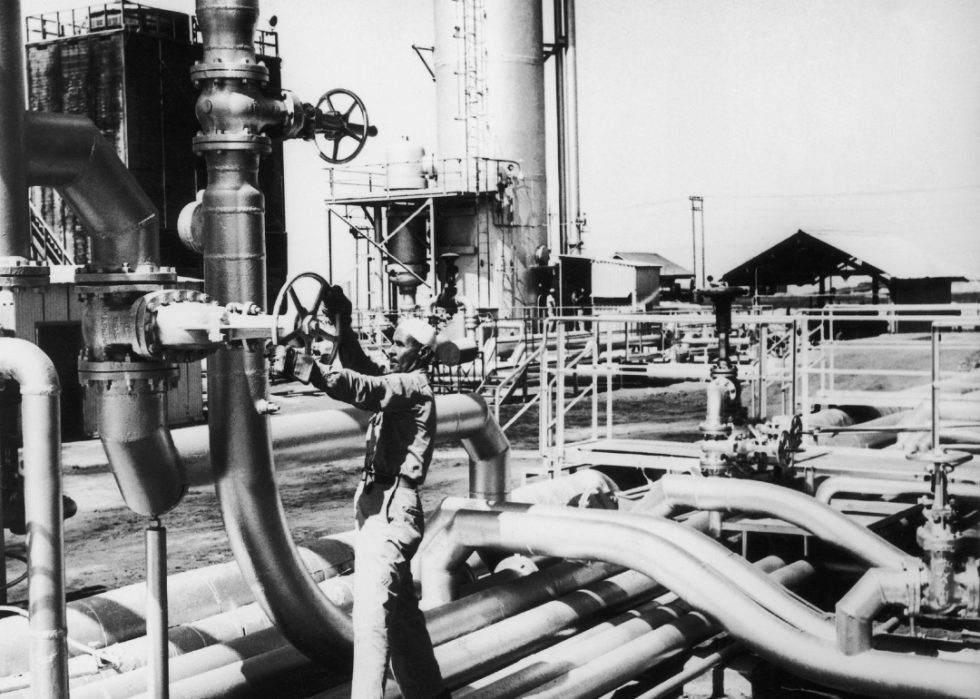
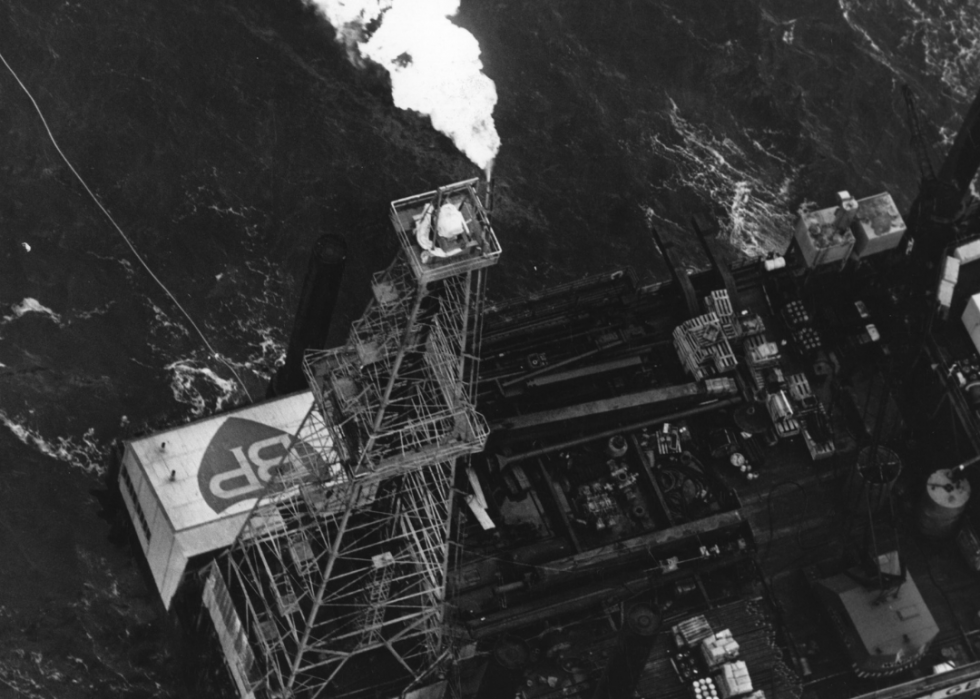
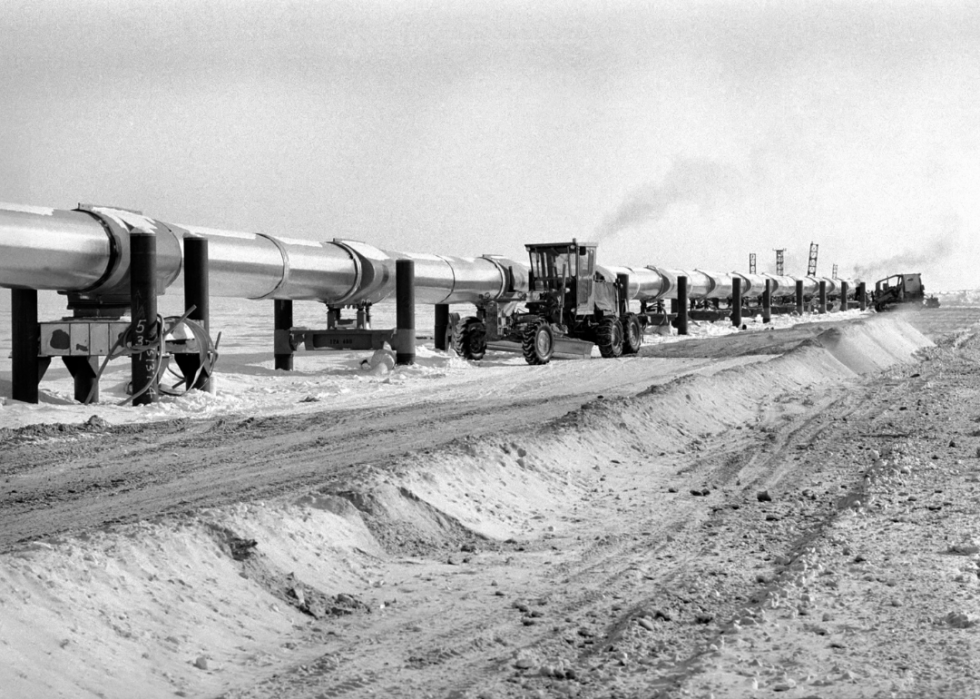
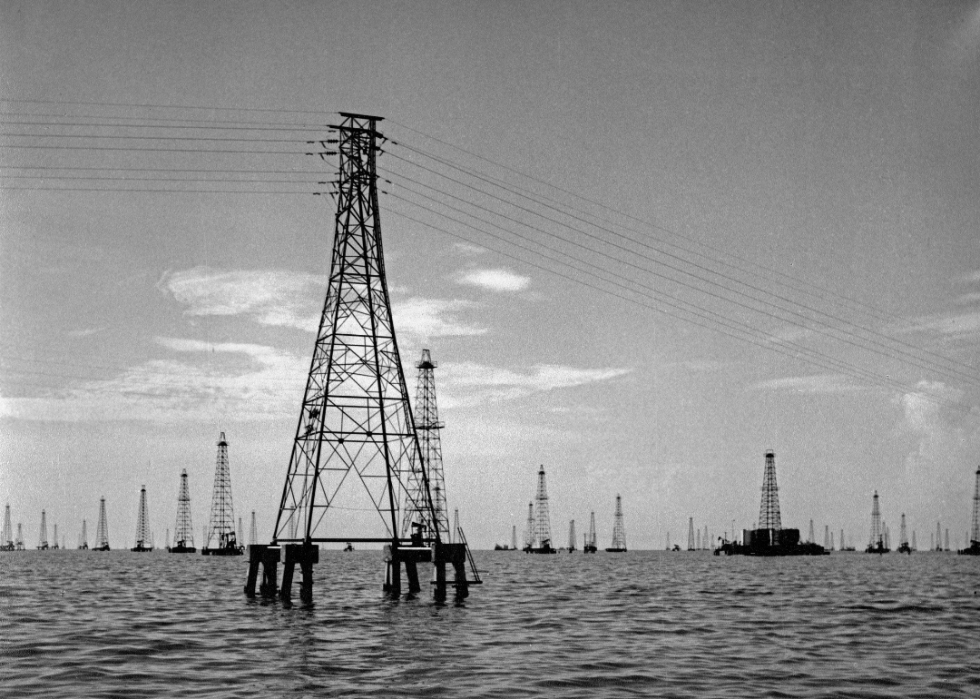
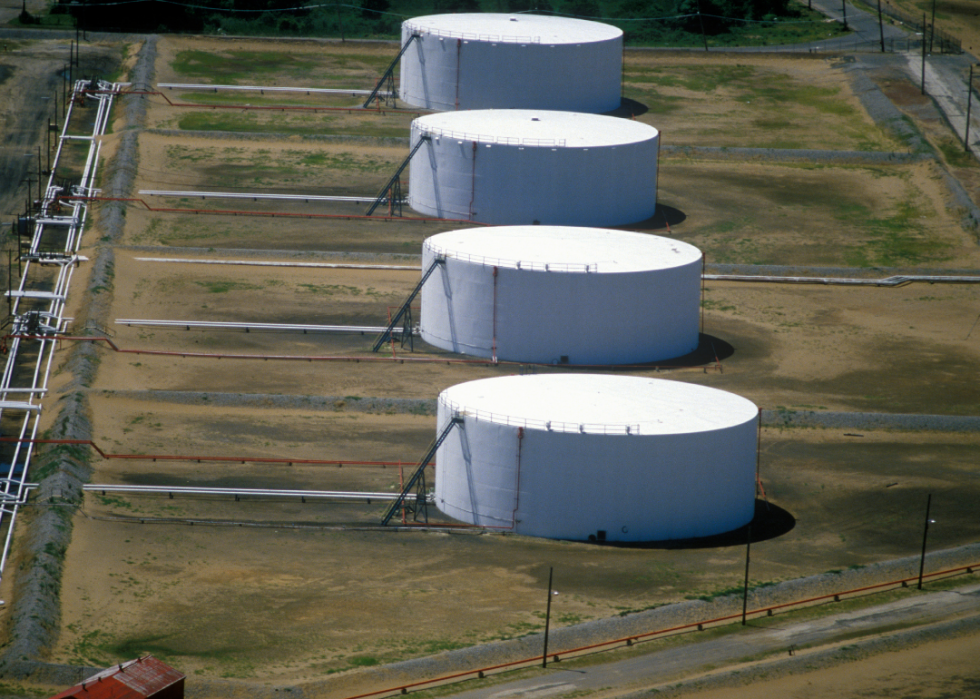
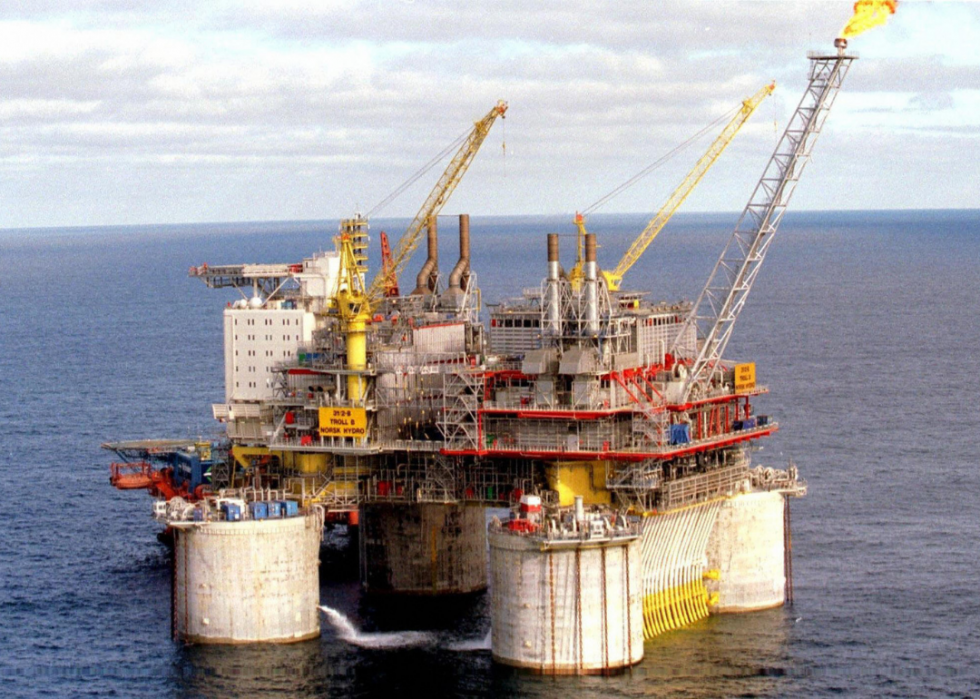
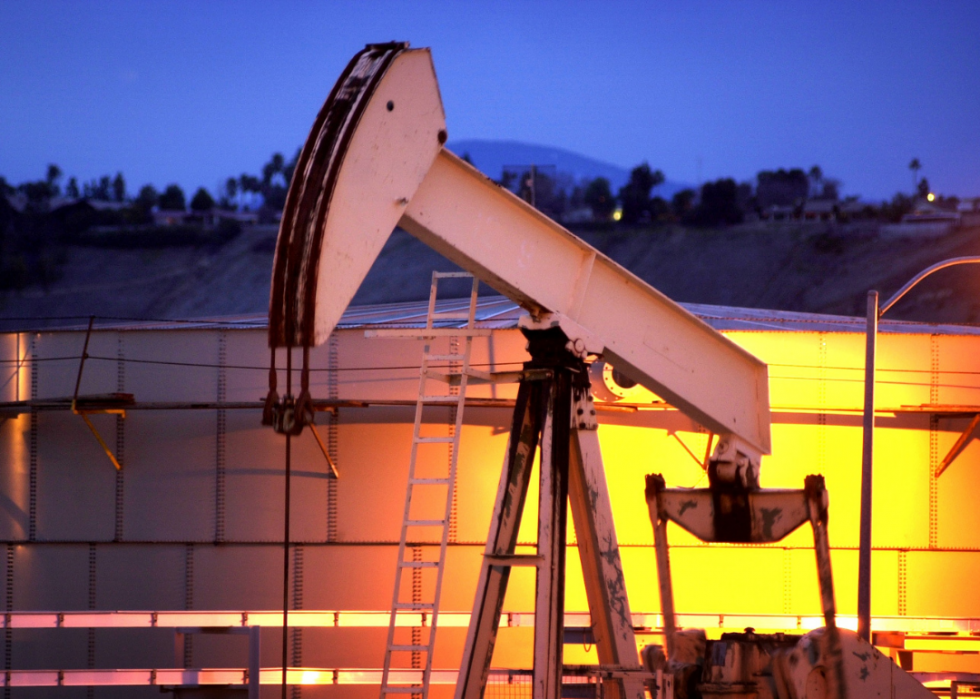
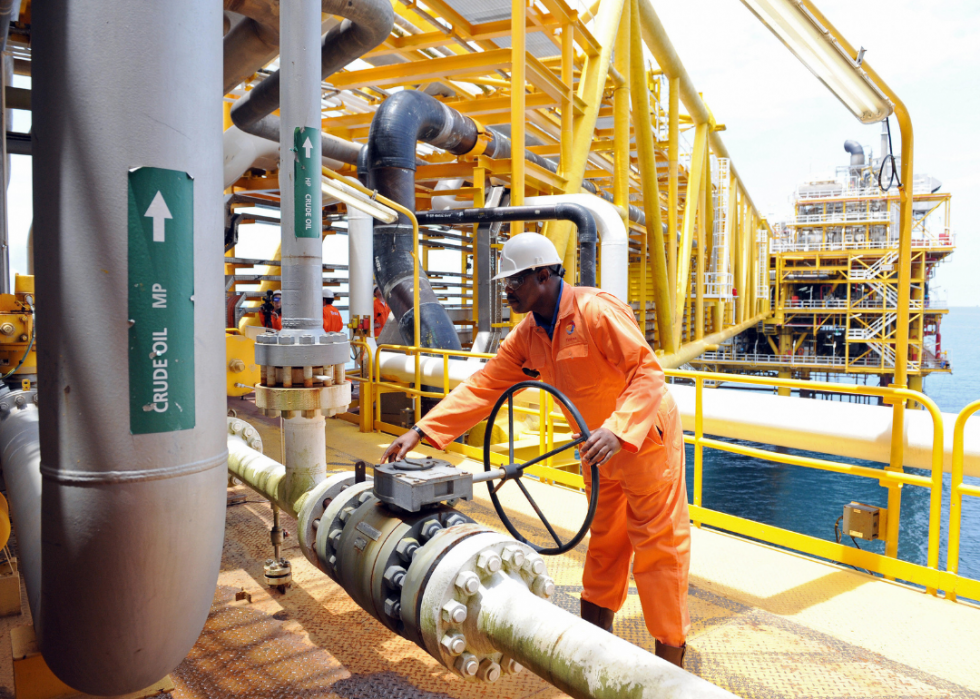
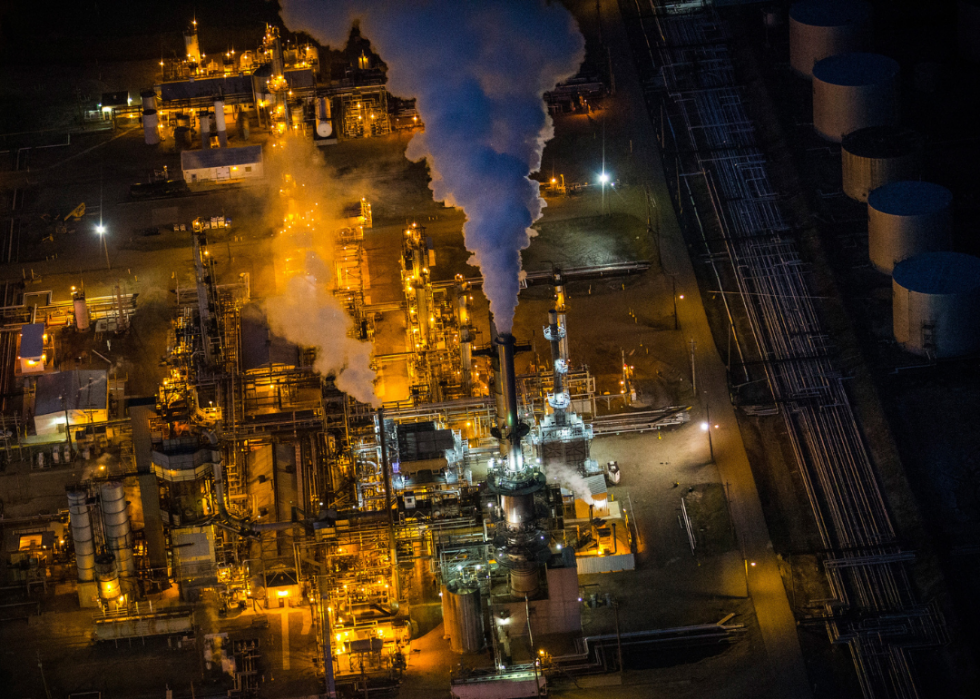
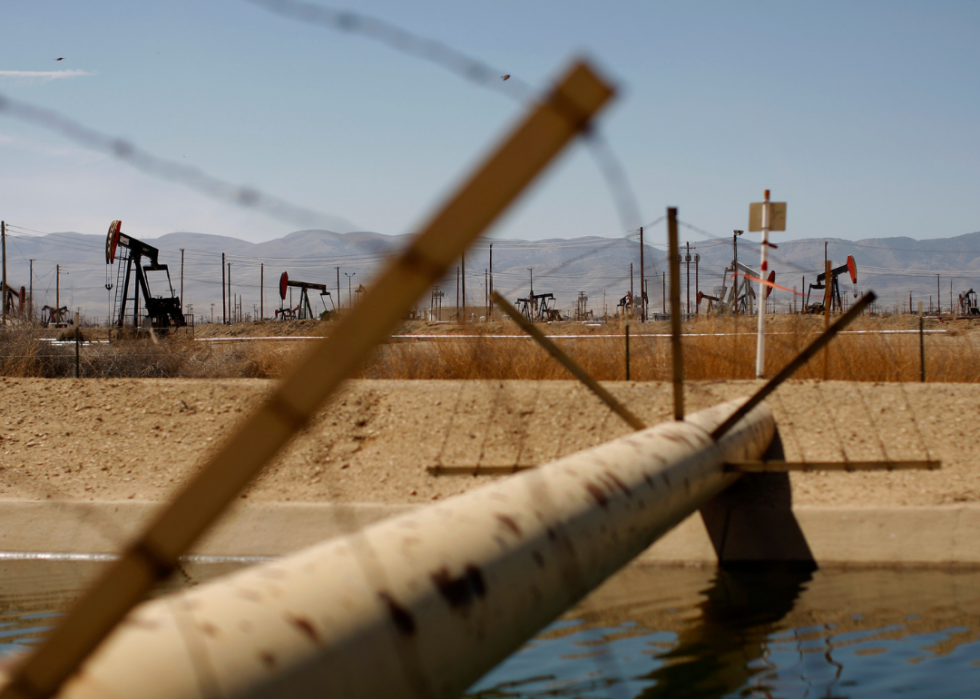
The United States has been among the top oil-producing nations since the advent of and regained the top spot in 2017 for the first time since 1974. The U.S. became a , ending a 70-year dependence on foreign oil.
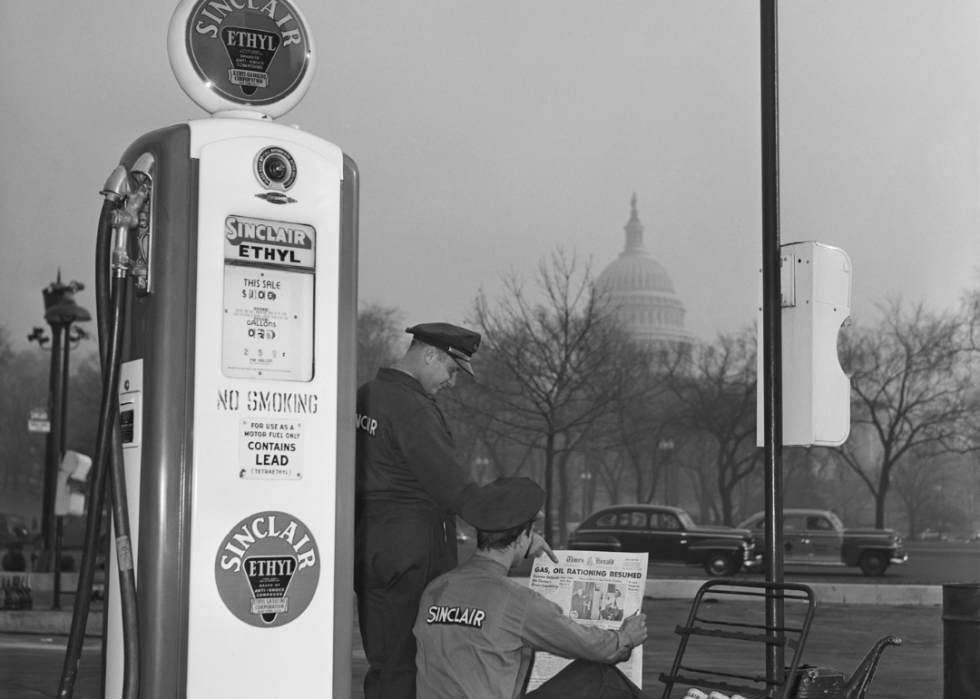
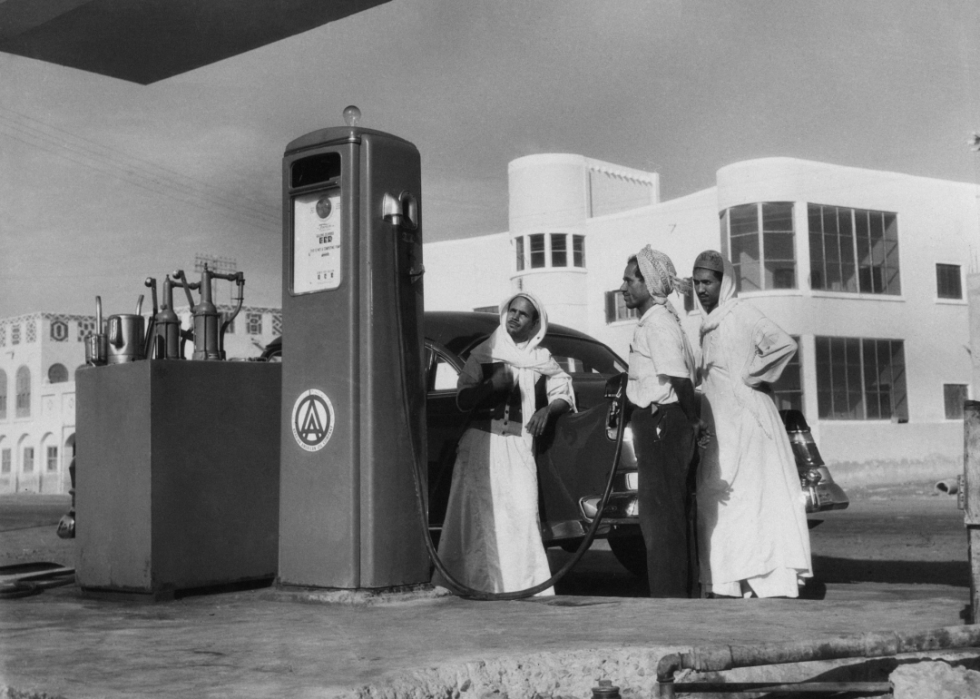
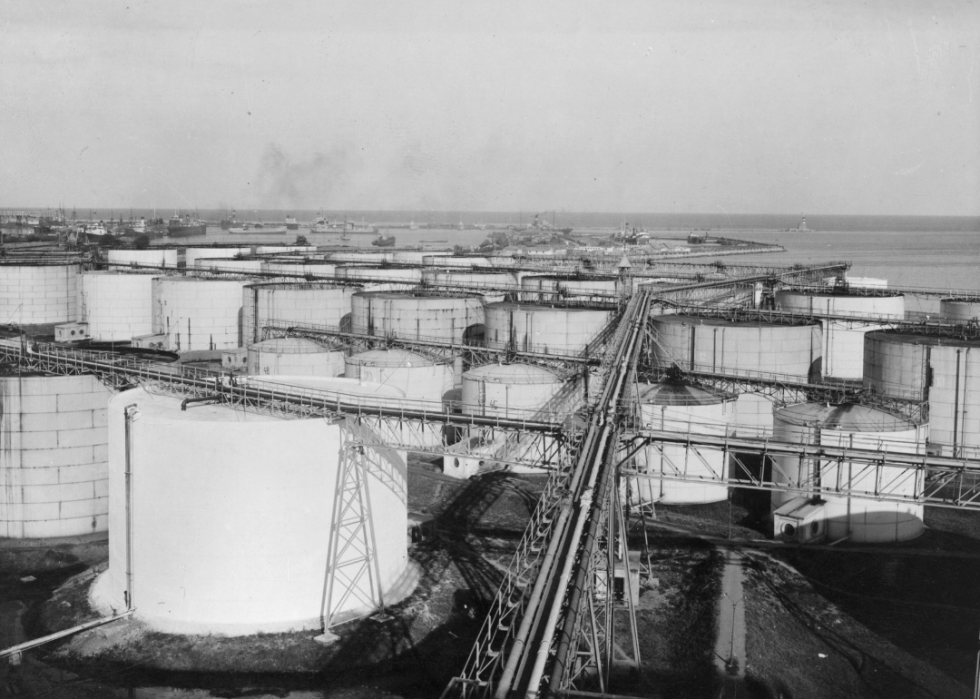
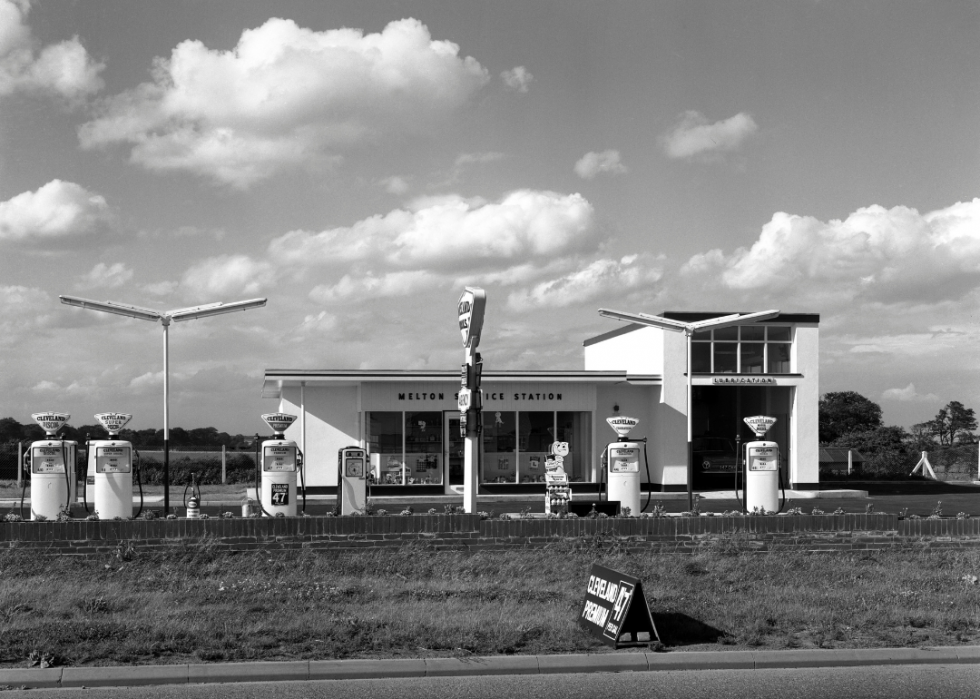
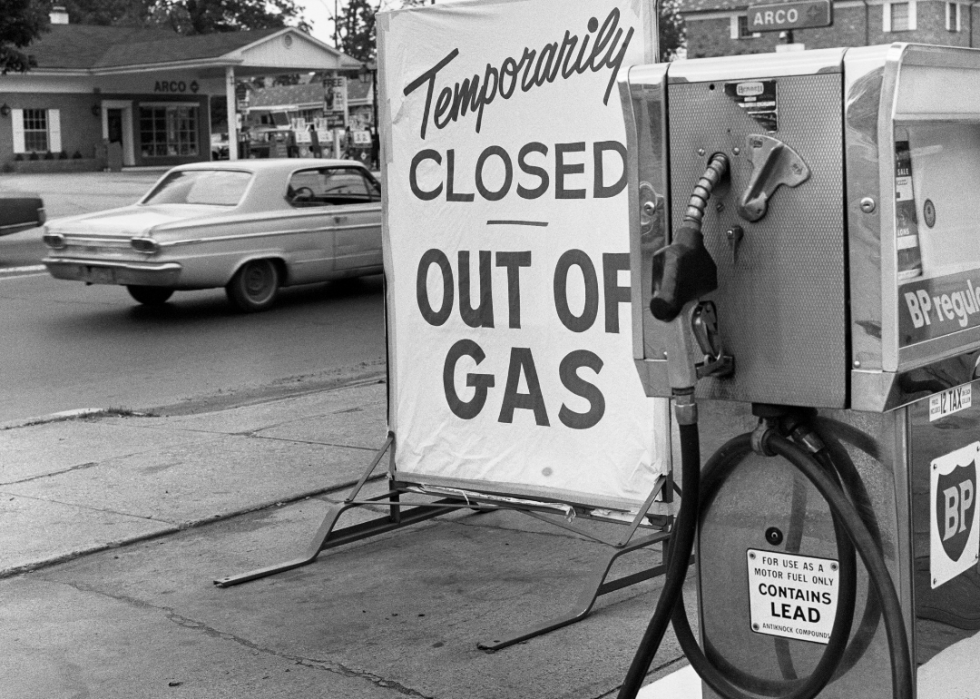
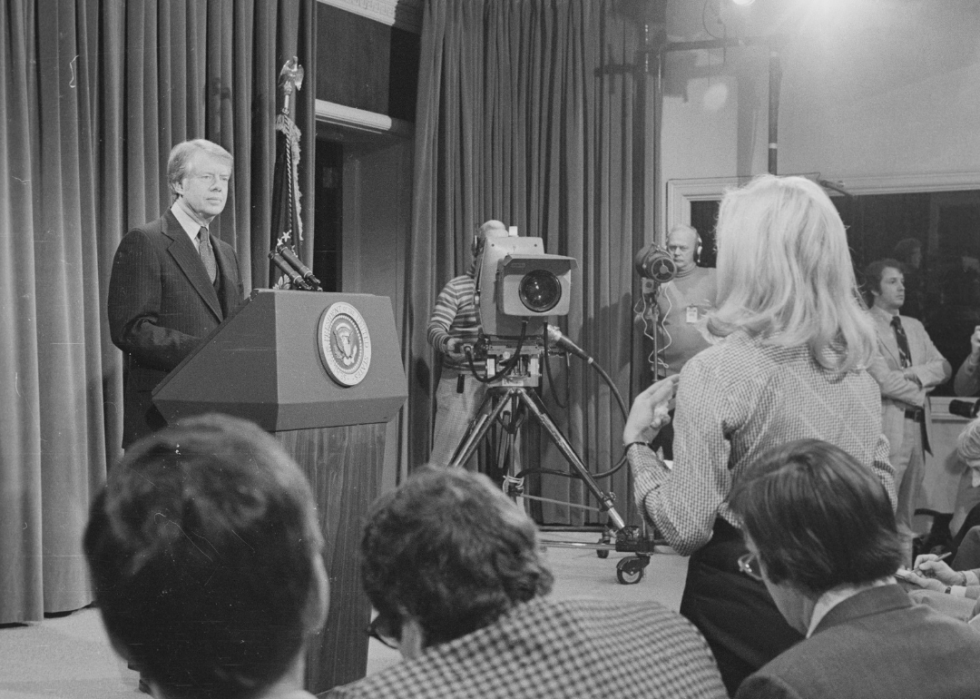
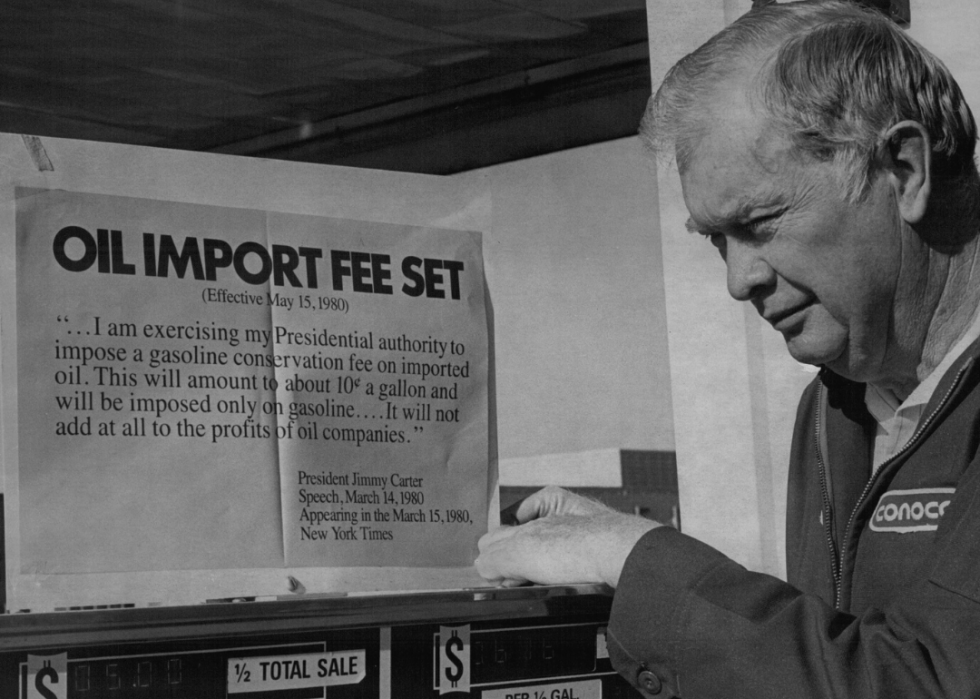
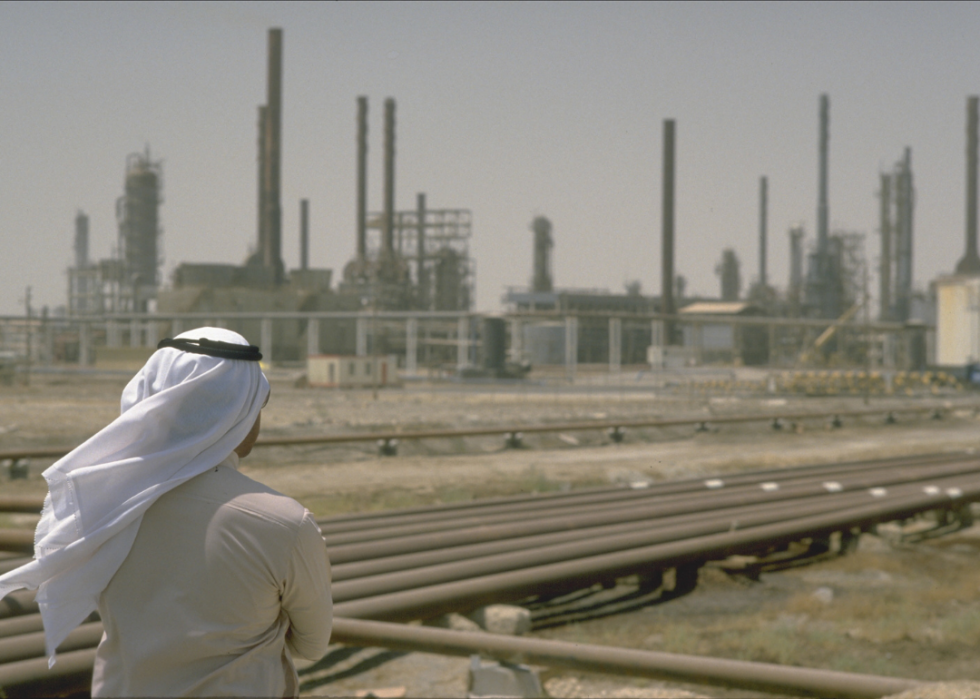
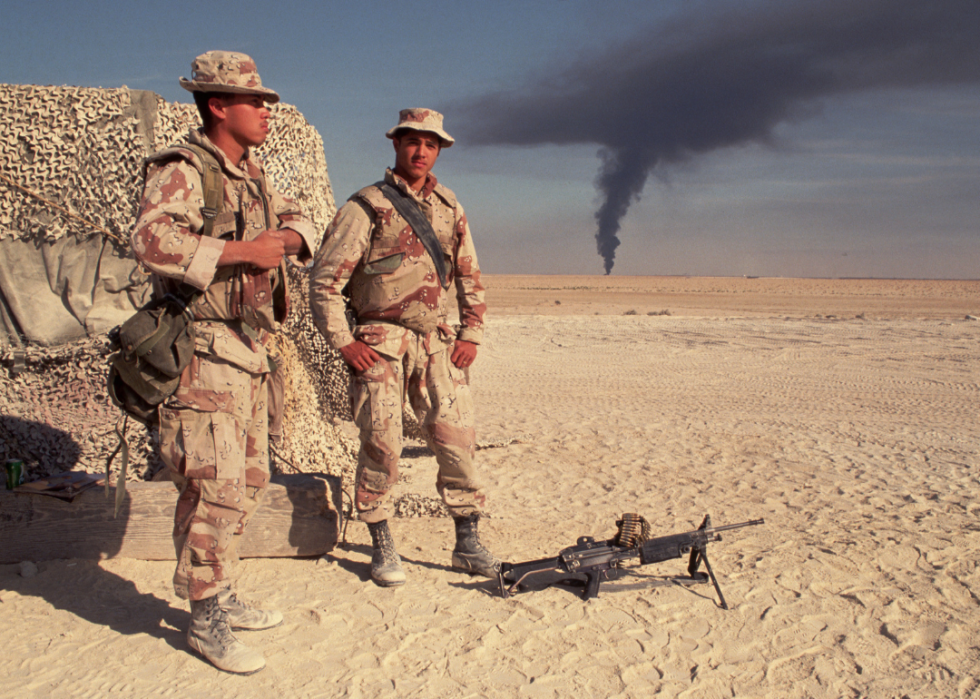
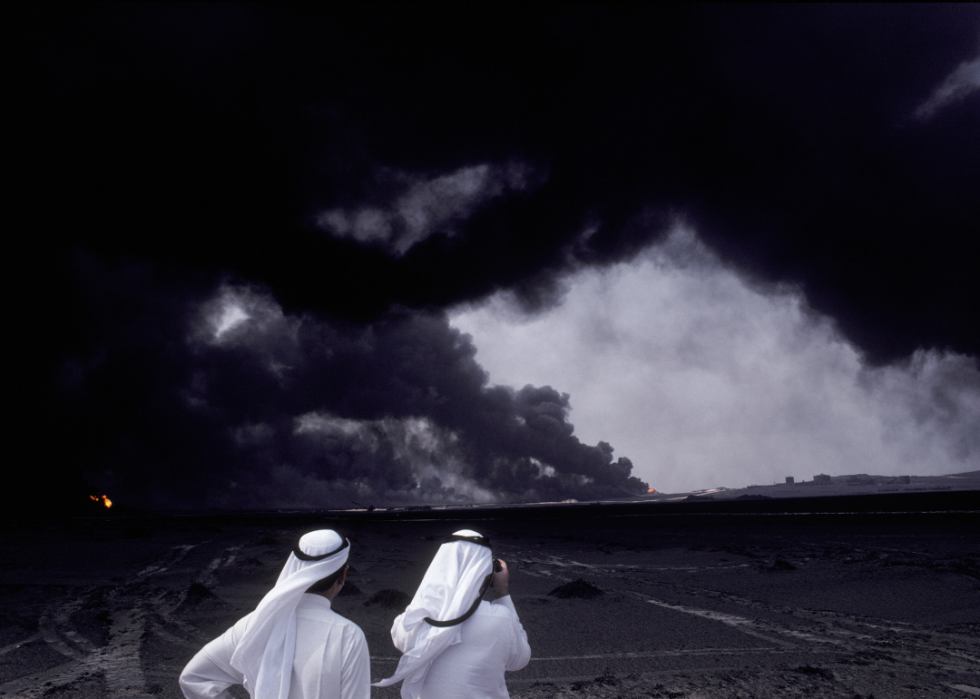
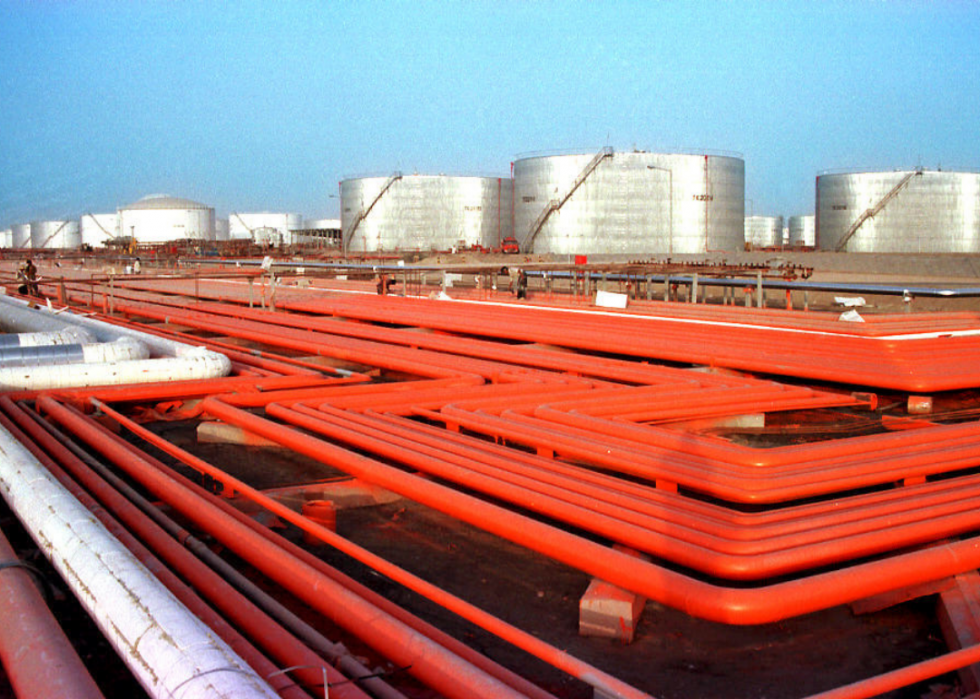
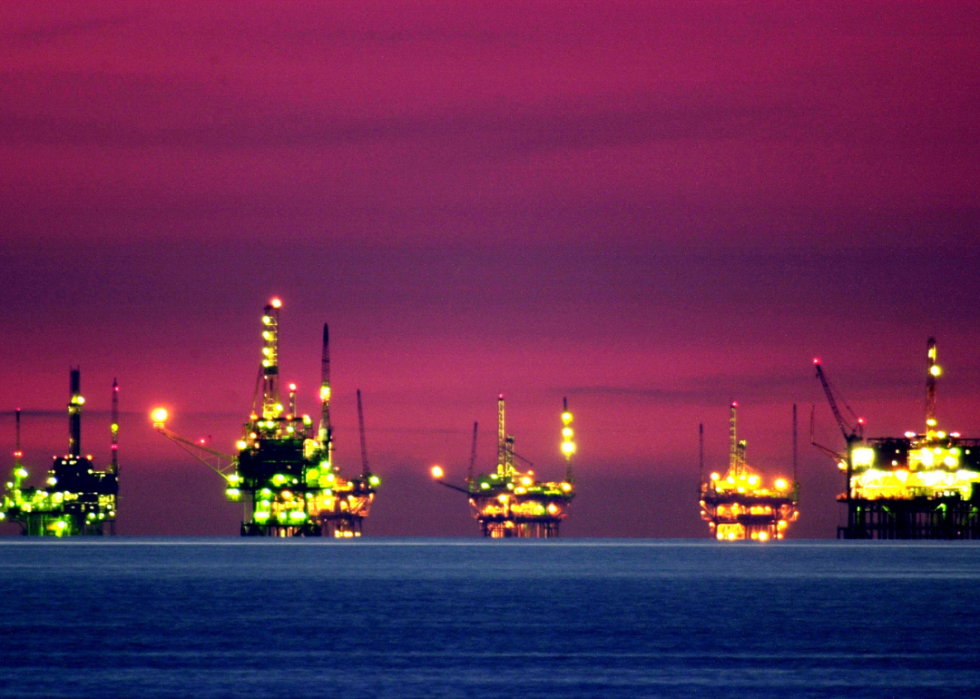
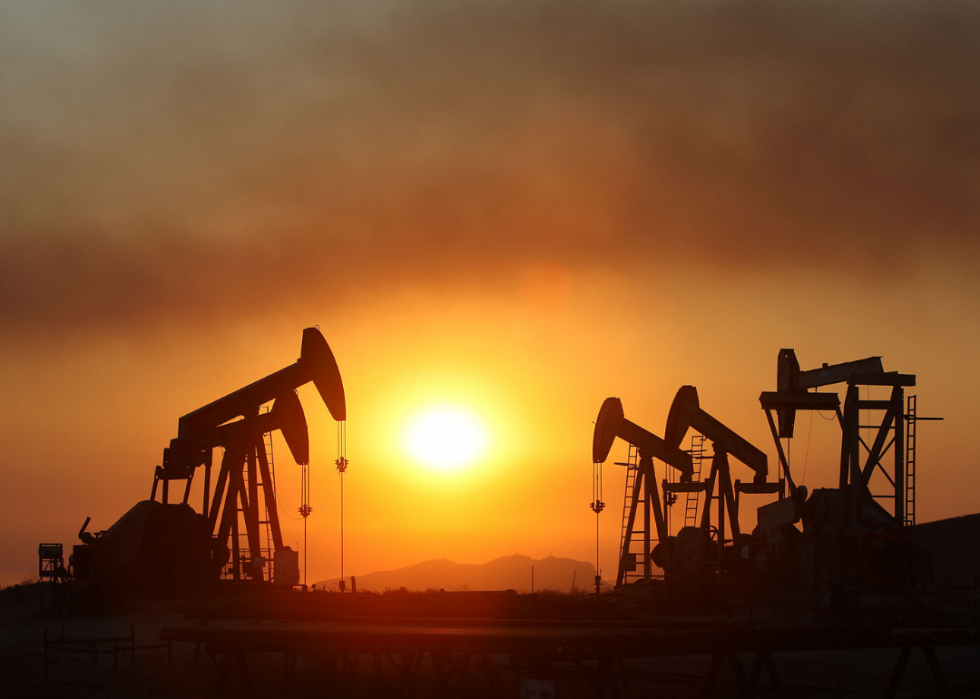
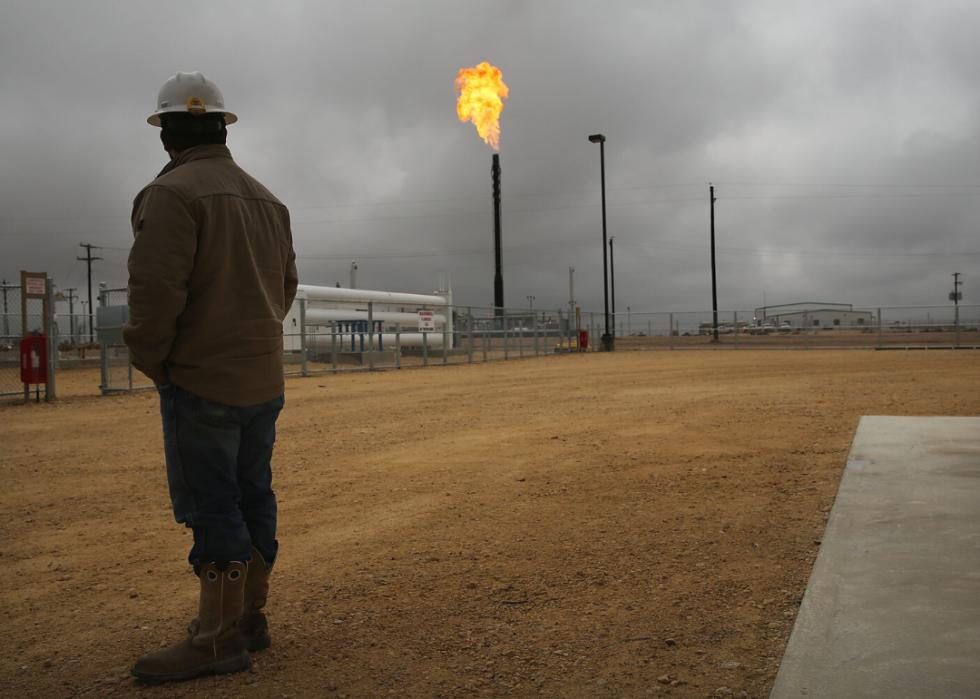
Several factors go into determining the price of oil on the world stage. The balance between supply and demand is among the most important, with the not to limit supply in late 2014 cutting the price of oil in half from its peak above $100 per barrel. Foreign policy has been another driver in the cost of oil, as poor diplomatic relations with Iran resulted in two and led to two wars in the 1990s and 2000s with Iraq.
Keep reading to find out more about the cost of oil the year you were born.
1920
- Average barrel of U.S. crude oil: $3.07 (+52.7% change from previous year)
- Inflation adjusted: $39.52 (+32.1%)
- Top oil producers:
--- #1. United States (722.5 TWh, +19.2% change from previous year)
--- #2. Mexico (283.9 TWh, +88.3%)
--- #3. Soviet Union (45.4 TWh, -12.1%)
--- #4. Indonesia (27.5 TWh, +9.5%)
--- #5. India (13.6 TWh, +0.5%)
This year, following a U.S. Geological Survey in 1919 that projected a drought within a decade, prompting the country to pass the Mineral Leasing Act of 1920. With crude oil at $3.07 a gallon, double what it was six years earlier, the U.S. was consuming 90% of its oil within the country, wiping out any gain, regardless of it accounting for 65% of global oil supply at the time.
1921
- Average barrel of U.S. crude oil: $1.73 (-43.6% change from previous year)
- Inflation adjusted: $24.88 (-37.0%)
- Top oil producers:
--- #1. United States (752.7 TWh, +4.2% change from previous year)
--- #2. Mexico (337.0 TWh, +18.7%)
--- #3. Soviet Union (44.2 TWh, -2.6%)
--- #4. Indonesia (27.4 TWh, -0.3%)
--- #5. India (14.7 TWh, +8.4%)
solidified Louisiana's place on the U.S. energy map after the discovery of the Monroe natural gas field in 1916 and the Homer oilfield in 1919. Meanwhile, California would become one of the leading global oil suppliers with the 1921 discovery of , a Long Beach-based oil field that delivered approximately 260,000 barrels of oil daily for two years.
1922
- Average barrel of U.S. crude oil: $1.61 (-6.9% change from previous year)
- Inflation adjusted: $24.67 (-0.8%)
- Top oil producers:
--- #1. United States (888.7 TWh, +18.1% change from previous year)
--- #2. Mexico (317.6 TWh, -5.7%)
--- #3. Soviet Union (54.7 TWh, +23.7%)
--- #4. Indonesia (27.7 TWh, +1.0%)
--- #5. Romania (16.0 TWh, +17.6%)
with the Barroso #2 well in Cabimas, a legendary discovery that brought forth 100,000 barrels of oil shooting as high as 130 feet, raining on homes for more than a week. The oil find was a game-changer for the country famous only for coffee and cocoa.
1923
- Average barrel of U.S. crude oil: $1.34 (-16.8% change from previous year)
- Inflation adjusted: $20.17 (-18.2%)
- Top oil producers:
--- #1. United States (1,167.3 TWh, +31.3% change from previous year)
--- #2. Mexico (264.0 TWh, -16.9%)
--- #3. Soviet Union (61.6 TWh, +12.8%)
--- #4. Indonesia (32.9 TWh, +18.9%)
--- #5. Romania (17.6 TWh, +10.1%)
with the 1923 Santa Rita find. After a group of Catholic nuns christened the well with rose petals, miracles were proven true, with the Permian Basin producing up to seven decades of commercial oil, with the Texon Oil and Land Company striking it big on May 29, 1923.
1924
- Average barrel of U.S. crude oil: $1.43 (+6.7% change from previous year)
- Inflation adjusted: $21.53 (+6.7%)
- Top oil producers:
--- #1. United States (1,140.0 TWh, -2.3% change from previous year)
--- #2. Mexico (248.5 TWh, -5.9%)
--- #3. Soviet Union (70.9 TWh, +15.1%)
--- #4. Indonesia (34.0 TWh, +3.3%)
--- #5. Romania (21.6 TWh, +23.0%)
This year, , would make its entrance into the oil industry. Since the 1909 foundation of the Anglo-Persian Oil Company and installation of a 145-mile pipeline, the year 1924 would mark the discovery of four commercial quantity oil wells in Persia, permanently making BP an oil mogul.
1925
- Average barrel of U.S. crude oil: $1.68 (+17.5% change from previous year)
- Inflation adjusted: $24.72 (+14.8%)
- Top oil producers:
--- #1. United States (1,216.8 TWh, +6.7% change from previous year)
--- #2. Mexico (205.0 TWh, -17.5%)
--- #3. Soviet Union (82.6 TWh, +16.4%)
--- #4. Indonesia (35.7 TWh, +4.8%)
--- #5. Romania (26.9 TWh, +24.6%)
Though the price of crude fuel was rising slowly by this year, The New York Times reported that in the U.S. would not exceed the prior year's record of 714,000,000 barrels, with the daily supply and demand average decreasing by 55,000 barrels from January to March.
1926
- Average barrel of U.S. crude oil: $1.88 (+11.9% change from previous year)
- Inflation adjusted: $27.35 (+10.6%)
- Top oil producers:
--- #1. United States (1,238.3 TWh, +1.8% change from previous year)
--- #2. Mexico (160.0 TWh, -21.9%)
--- #3. Soviet Union (96.5 TWh, +16.9%)
--- #4. Romania (37.7 TWh, +40.0%)
--- #5. Indonesia (35.1 TWh, -1.5%)
By 1926, southwest regions like while the blew its first gasket. Meanwhile, while state policy and the Great Depression significantly determined the supply and pricing of fuel, lines to feed more than 6,000 pumps needed to keep up with the influx of American and European automobiles.
1927
- Average barrel of U.S. crude oil: $1.30 (-30.9% change from previous year)
- Inflation adjusted: $19.23 (-29.7%)
- Top oil producers:
--- #1. United States (1,436.1 TWh, +16.0% change from previous year)
--- #2. Soviet Union (119.8 TWh, +24.1%)
--- #3. Mexico (113.1 TWh, -29.3%)
--- #4. Indonesia (43.0 TWh, +22.4%)
--- #5. Romania (42.7 TWh, +13.1%)
Notable Iraq oil field in the breast of Baba Gurgur, giving the country's petroleum company significant power in the global oil industry. Though production would take another seven years to complete, the Kirkuk oil field, which had lines to Haifa and Lebanon, would become one of Iraq's most significant reservoirs.
1928
- Average barrel of U.S. crude oil: $1.17 (-10.0% change from previous year)
- Inflation adjusted: $17.62 (-8.4%)
- Top oil producers:
--- #1. United States (1,437.4 TWh, +0.1% change from previous year)
--- #2. Soviet Union (134.9 TWh, +12.6%)
--- #3. Mexico (83.5 TWh, -26.2%)
--- #4. Indonesia (50.1 TWh, +16.6%)
--- #5. Romania (49.8 TWh, +16.7%)
reportedly the start of the global oil monopoly, was a formalized agreement among a seven oil company consortium regarding the Iraq Petroleum Company (IPC). five of the companies, which were U.S. owned, and two others barred themselves from independently drilling oil from individual sections of the Middle East.
1929
- Average barrel of U.S. crude oil: $1.27 (+8.5% change from previous year)
- Inflation adjusted: $19.12 (+8.5%)
- Top oil producers:
--- #1. United States (1,606.2 TWh, +11.7% change from previous year)
--- #2. Soviet Union (159.3 TWh, +18.1%)
--- #3. Mexico (74.4 TWh, -10.9%)
--- #4. Indonesia (60.9 TWh, +21.6%)
--- #5. Romania (56.3 TWh, +13.0%)
peaked in October 1929, with up to 545 million barrels in reserves, while Texas, Oklahoma, California, and Southwest discoveries kept coming. But beyond the bountiful oil supply was the Great Depression, which greatly affected the U.S. oil industry.
1930
- Average barrel of U.S. crude oil: $1.19 (-6.3% change from previous year)
- Inflation adjusted: $18.35 (-4.1%)
- Top oil producers:
--- #1. United States (1,431.9 TWh, -10.9% change from previous year)
--- #2. Soviet Union (215.2 TWh, +35.0%)
--- #3. Romania (67.4 TWh, +19.7%)
--- #4. Mexico (65.8 TWh, -11.5%)
--- #5. Indonesia (58.5 TWh, -4.0%)
While the Lone Star State was already America's leading state for oil production, the set it in stone. However, when the with oil, it would set in motion a series of financial events that, combined with the Great Depression, would cause an oil oversupply, dropping prices dramatically from $1.19 to $0.65 by the following year.
1931
- Average barrel of U.S. crude oil: $0.65 (-45.4% change from previous year)
- Inflation adjusted: $11.01 (-40.0%)
- Top oil producers:
--- #1. United States (1,357.0 TWh, -5.2% change from previous year)
--- #2. Soviet Union (260.5 TWh, +21.1%)
--- #3. Romania (78.6 TWh, +16.6%)
--- #4. Mexico (55.0 TWh, -16.4%)
--- #5. Indonesia (53.5 TWh, -8.6%)
Due to an oil glut, specifically in East Texas, crude oil prices dropped dangerously low in 1931 from the prior year. The oversupply, coupled with the Great Depression, brought on devastating deflation and unemployment percentages comparable .
1932
- Average barrel of U.S. crude oil: $0.87 (+33.8% change from previous year)
- Inflation adjusted: $16.35 (+48.5%)
- Top oil producers:
--- #1. United States (1,251.9 TWh, -7.7% change from previous year)
--- #2. Soviet Union (248.9 TWh, -4.5%)
--- #3. Romania (85.5 TWh, +8.8%)
--- #4. Indonesia (59.0 TWh, +10.2%)
--- #5. Mexico (54.6 TWh, -0.7%)
In 1932, a subsidiary of the Standard Oil of California (SOCAL) struck oil in Saudi Arabia, forever changing the fuel industry landscape in the country. Within a year, SOCAL was granted permission to over six decades.
1933
- Average barrel of U.S. crude oil: $0.67 (-23.0% change from previous year)
- Inflation adjusted: $13.27 (-18.8%)
- Top oil producers:
--- #1. United States (1,425.1 TWh, +13.8% change from previous year)
--- #2. Soviet Union (250.0 TWh, +0.5%)
--- #3. Romania (85.8 TWh, +0.4%)
--- #4. Indonesia (64.4 TWh, +9.2%)
--- #5. Mexico (56.6 TWh, +3.6%)
President Franklin D. Roosevelt's New Deal in 1933 directly affected crude oil prices, with new regulations and financial reforms affecting the U.S. energy market, . Under Roosevelt's administration, the government imported oil to prevent cheaper types from saturating the market.
1934
- Average barrel of U.S. crude oil: $1.00 (+49.3% change from previous year)
- Inflation adjusted: $19.21 (+44.8%)
- Top oil producers:
--- #1. United States (1,429.7 TWh, +0.3% change from previous year)
--- #2. Soviet Union (281.4 TWh, +12.6%)
--- #3. Romania (98.5 TWh, +14.8%)
--- #4. Indonesia (70.4 TWh, +9.4%)
--- #5. Mexico (63.6 TWh, +12.3%)
By 1934, the New York Times reports , up from 1,417, 891, 400 from the prior year. Meanwhile, production after the 1927 discovery of the Baba Gurgur well, one of its most significant fuel discoveries.
1935
- Average barrel of U.S. crude oil: $0.97 (-3.0% change from previous year)
- Inflation adjusted: $18.23 (-5.1%)
- Top oil producers:
--- #1. United States (1,566.3 TWh, +9.6% change from previous year)
--- #2. Soviet Union (293.1 TWh, +4.1%)
--- #3. Romania (97.4 TWh, -1.1%)
--- #4. Indonesia (70.7 TWh, +0.4%)
--- #5. Mexico (67.5 TWh, +6.2%)
, U.S. oil-producing states continue to abide by the numbers and price recovery begins. Central California's Semitropic Oil Field, in the San Joaquin Valley, was discovered by the Standard Oil Company this year. The company believed it was just a natural gas basin but turned out to be an oil well 21 years later in 1956.
1936
- Average barrel of U.S. crude oil: $1.09 (+12.4% change from previous year)
- Inflation adjusted: $20.19 (+10.8%)
- Top oil producers:
--- #1. United States (1,728.3 TWh, +10.3% change from previous year)
--- #2. Soviet Union (318.7 TWh, +8.7%)
--- #3. Romania (101.2 TWh, +3.9%)
--- #4. Indonesia (74.9 TWh, +5.9%)
--- #5. Mexico (68.4 TWh, +1.2%)
Standard Oil of California (SOCAL) with California Arabian Standard Oil Company (CASOC) in 1936. Subsequent surveys of the well failed for two years, but Chief geologist encouraged two more years of drilling, that paid off with the famous Saudi Arabian oil boom beginning in 1938.
1937
- Average barrel of U.S. crude oil: $1.18 (+8.3% change from previous year)
- Inflation adjusted: $21.10 (+4.5%)
- Top oil producers:
--- #1. United States (2,010.4 TWh, +16.3% change from previous year)
--- #2. Soviet Union (331.5 TWh, +4.0%)
--- #3. Indonesia (84.5 TWh, +12.8%)
--- #4. Romania (83.2 TWh, -17.8%)
--- #5. Mexico (78.0 TWh, +14.2%)
strike would keep it on the map as the world's second-largest onshore oil well discovery of all time, with anywhere between 66 billion to 72 billion barrels of recoverable fuel. Meanwhile, workers due to unfair labor practices had President Lazaro Cardenas draw up the takeover of the Mexican Eagle Company that accounted for more than half of the country's oil production.
1938
- Average barrel of U.S. crude oil: $1.13 (-4.2% change from previous year)
- Inflation adjusted: $20.63 (-2.2%)
- Top oil producers:
--- #1. United States (1,908.6 TWh, -5.1% change from previous year)
--- #2. Soviet Union (351.2 TWh, +6.0%)
--- #3. Indonesia (86.0 TWh, +1.9%)
--- #4. Romania (76.7 TWh, -7.8%)
--- #5. Mexico (64.1 TWh, -17.9%)
became undeniable in 1938, with one of its largest discoveries after five years of drilling. After U.S. geologists struck oil in the Saudi Arabian desert in 1933, drilling continued until commercial oil quantities spewed from the Dammam Dome by Dhahran in 1938.
1939
- Average barrel of U.S. crude oil: $1.02 (-9.7% change from previous year)
- Inflation adjusted: $18.89 (-8.4%)
- Top oil producers:
--- #1. United States (1,988.1 TWh, +4.2% change from previous year)
--- #2. Soviet Union (352.4 TWh, +0.3%)
--- #3. Indonesia (92.4 TWh, +7.4%)
--- #4. Romania (72.6 TWh, -5.4%)
--- #5. Mexico (71.4 TWh, +11.4%)
World War II officially began this year, with the U.S. placing oil supply at the top of the priority list. This year the Arabian American Oil Company and kerosene in exchange for a more-extensive search area in the country, adding six years on the original contract, extending the seemingly-lucrative foreign partnership.
1940
- Average barrel of U.S. crude oil: $1.02 (0.0% change from previous year)
- Inflation adjusted: $18.76 (-0.7%)
- Top oil producers:
--- #1. United States (2,126.8 TWh, +7.0% change from previous year)
--- #2. Soviet Union (361.7 TWh, +2.6%)
--- #3. Indonesia (92.3 TWh, -0.1%)
--- #4. Mexico (73.3 TWh, +2.7%)
--- #5. Romania (67.6 TWh, -6.9%)
Nebraska put itself on the oil map with the Cornhusker State's first well discovery made by the near Falls City. However, low oil demand and a shortage of southeastern Nebraska oil refineries prompted to keep the price up.
1941
- Average barrel of U.S. crude oil: $1.14 (+11.8% change from previous year)
- Inflation adjusted: $19.97 (+6.4%)
- Top oil producers:
--- #1. United States (2,203.8 TWh, +3.6% change from previous year)
--- #2. Soviet Union (374.5 TWh, +3.5%)
--- #3. Indonesia (80.1 TWh, -13.3%)
--- #4. Mexico (71.6 TWh, -2.2%)
--- #5. Romania (63.4 TWh, -6.1%)
On Dec. 7, 1941, in hopes of hitting the U.S. Navy's island oil storage of 4 million barrels, but it missed, keeping the price of oil stable in the U.S, which at the time supplied 60% of the world oil supply. That attack came after America cut off Japan from any oil supply when it found out it was piling up excess oil and drilling equipment.
1942
- Average barrel of U.S. crude oil: $1.19 (+4.4% change from previous year)
- Inflation adjusted: $18.80 (-5.9%)
- Top oil producers:
--- #1. United States (2,179.3 TWh, -1.1% change from previous year)
--- #2. Soviet Union (358.0 TWh, -4.4%)
--- #3. Romania (65.9 TWh, +3.9%)
--- #4. Mexico (57.9 TWh, -19.1%)
--- #5. Argentina (39.4 TWh, +7.7%)
Since the attack on Pearl Harbor, World War II had Americans watching every penny and dime, even rationing gas to keep the economy balanced. "Do Your Bit, Skate to Work, Save Gas," banners were carried by beautiful models on New York City streets to get attention.
1943
- Average barrel of U.S. crude oil: $1.20 (+0.8% change from previous year)
- Inflation adjusted: $17.86 (-5.0%)
- Top oil producers:
--- #1. United States (2,365.6 TWh, +8.5% change from previous year)
--- #2. Soviet Union (318.2 TWh, -11.1%)
--- #3. Indonesia (72.1 TWh, +101.2%)
--- #4. Romania (61.3 TWh, -6.9%)
--- #5. Mexico (58.5 TWh, +1.0%)
U.S. began a serious relationship with the Middle East based solely on oil, due to Saudi Arabia's boundless supply and America's dwindling reserves. President Franklin Roosevelt wasted no time providing Saudi Arabia with monetary support in exchange for alliance and oil supply assistance.
1944
- Average barrel of U.S. crude oil: $1.21 (+0.8% change from previous year)
- Inflation adjusted: $17.70 (-0.9%)
- Top oil producers:
--- #1. United States (2,637.1 TWh, +11.5% change from previous year)
--- #2. Soviet Union (433.0 TWh, +36.1%)
--- #3. Mexico (63.6 TWh, +8.7%)
--- #4. Iraq (48.4 TWh, +16.6%)
--- #5. Romania (41.0 TWh, -33.2%)
1944 marked the year of the , also called the Washington Agreement, between Britain and the U.S. to collectively control petroleum supply and demand between the two countries. The U.S. attempt to control future oil supplies would fail, with as a "tardy and groping expression" to begin with at all.
1945
- Average barrel of U.S. crude oil: $1.22 (+0.8% change from previous year)
- Inflation adjusted: $17.45 (-1.4%)
- Top oil producers:
--- #1. United States (2,693.3 TWh, +2.1% change from previous year)
--- #2. Soviet Union (225.6 TWh, -47.9%)
--- #3. Mexico (72.5 TWh, +14.0%)
--- #4. Romania (54.0 TWh, +31.6%)
--- #5. Iraq (53.6 TWh, +10.6%)
President Franklin D. Roosevelt negotiated one of the U.S.'s most , with Saudi King Abdul Aziz in 1945. A notable private wartime meeting between the two on a U.S. Navy destroyer floating on the Suez Canal solidified the support and financial friendship forming between the new allies.
1946
- Average barrel of U.S. crude oil: $1.41 (+15.6% change from previous year)
- Inflation adjusted: $18.62 (+6.7%)
- Top oil producers:
--- #1. United States (2,725.2 TWh, +1.2% change from previous year)
--- #2. Soviet Union (252.9 TWh, +12.1%)
--- #3. Mexico (81.9 TWh, +13.1%)
--- #4. Iraq (54.4 TWh, +1.6%)
--- #5. Romania (48.8 TWh, -9.6%)
War-end prosperity was reflected in 1946 crude oil prices. Not only was there but the automobile industry also boomed like never before from 1945 to 1950, increasing production from 26 million to 40 million cars.
1947
- Average barrel of U.S. crude oil: $1.93 (+36.9% change from previous year)
- Inflation adjusted: $22.28 (+19.7%)
- Top oil producers:
--- #1. United States (2,918.6 TWh, +7.1% change from previous year)
--- #2. Soviet Union (302.6 TWh, +19.7%)
--- #3. Mexico (93.7 TWh, +14.3%)
--- #4. Iraq (54.7 TWh, +0.5%)
--- #5. Romania (44.3 TWh, -9.1%)
After drilling 133 times in 1947, Imperial Oil was losing hope. But then the near Edmonton, Alberta, gushed oil, launching Canada's oil industry and inspiring investment dollars after other discoveries in the region.
1948
- Average barrel of U.S. crude oil: $2.60 (+34.7% change from previous year)
- Inflation adjusted: $27.77 (+24.7%)
- Top oil producers:
--- #1. United States (3,175.1 TWh, +8.8% change from previous year)
--- #2. Soviet Union (340.2 TWh, +12.4%)
--- #3. Mexico (97.4 TWh, +4.0%)
--- #4. Kuwait (74.4 TWh, +190.9%)
--- #5. Indonesia (50.6 TWh, +290.6%)
was an effort to assist postwar Europe getting back on its feet after World War II, with the U.S. giving the continent up to $11 billion in oil aid. While the hand out seemed benevolent, that the Marshall Plan's U.S. oil policy would "secure a dominant role for U.S. producers in the Middle East."
1949
- Average barrel of U.S. crude oil: $2.54 (-2.3% change from previous year)
- Inflation adjusted: $27.48 (-1.1%)
- Top oil producers:
--- #1. United States (2,894.9 TWh, -8.8% change from previous year)
--- #2. Soviet Union (389.0 TWh, +14.3%)
--- #3. Kuwait (144.0 TWh, +93.4%)
--- #4. Mexico (90.9 TWh, -6.6%)
--- #5. Indonesia (72.1 TWh, +42.6%)
By the end of 1949, the and 11 oil and natural gas fields, with Mexico, Russia, and Romania as three top producers. Additional oil power can also be found in numbers, with up to 65% of all global crude oil basins.
1950
- Average barrel of U.S. crude oil: $2.51 (-1.2% change from previous year)
- Inflation adjusted: $26.81 (-2.4%)
- Top oil producers:
--- #1. United States (3,101.8 TWh, +7.1% change from previous year)
--- #2. Soviet Union (440.5 TWh, +13.3%)
--- #3. Kuwait (199.9 TWh, +38.9%)
--- #4. Mexico (118.1 TWh, +29.9%)
--- #5. Indonesia (82.3 TWh, +14.2%)
marked 4.4 billion barrels of oil used globally compared to the 0.1 billion exactly 50 years earlier in 1900. With exploration methods and drilling techniques more efficient than five decades earlier, the 1950s would become one of the most important decades in the industry's history.
1951
- Average barrel of U.S. crude oil: $2.53 (+0.8% change from previous year)
- Inflation adjusted: $25.05 (-6.6%)
- Top oil producers:
--- #1. United States (3,532.7 TWh, +13.9% change from previous year)
--- #2. Soviet Union (491.4 TWh, +11.6%)
--- #3. Kuwait (325.8 TWh, +63.0%)
--- #4. Mexico (126.1 TWh, +6.7%)
--- #5. Iraq (99.9 TWh, +30.5%)
The world's largest oil field to date in Ghawar began spewing forth oil in 1951, three years after the 1948 discovery. Three decades later, in 1981, it was , reportedly the highest sustaining oil production from any field in the history of drilling.
1952
- Average barrel of U.S. crude oil: $2.53 (0.0% change from previous year)
- Inflation adjusted: $24.58 (-1.9%)
- Top oil producers:
--- #1. United States (3,598.9 TWh, +1.9% change from previous year)
--- #2. Soviet Union (550.2 TWh, +12.0%)
--- #3. Kuwait (434.8 TWh, +33.4%)
--- #4. Iraq (215.4 TWh, +115.6%)
--- #5. Mexico (127.7 TWh, +1.3%)
Conventional oil discoveries outside of North America hit their lowest level until 2015 in 1952. Instability in Iran led to the after production fell from 242 million barrels in 1950 to just 10 million in 1952.
1953
- Average barrel of U.S. crude oil: $2.68 (+5.9% change from previous year)
- Inflation adjusted: $25.84 (+5.1%)
- Top oil producers:
--- #1. United States (3,704.6 TWh, +2.9% change from previous year)
--- #2. Soviet Union (613.8 TWh, +11.6%)
--- #3. Kuwait (500.3 TWh, +15.1%)
--- #4. Iraq (327.8 TWh, +52.2%)
--- #5. Canada (126.5 TWh, +32.1%)
Iranian Prime Minister Mohammad Mossadeq nationalized the country's oil industry for two straight years before being overthrown by the U.S. and British intelligence agencies in 1953. One of the world's largest fuel basins was tapped onshore in recovering 17 billion gallons of oil as of 2019.
1954
- Average barrel of U.S. crude oil: $2.78 (+3.7% change from previous year)
- Inflation adjusted: $26.61 (+3.0%)
- Top oil producers:
--- #1. United States (3,638.4 TWh, -1.8% change from previous year)
--- #2. Soviet Union (689.4 TWh, +12.3%)
--- #3. Kuwait (557.3 TWh, +11.4%)
--- #4. Iraq (356.2 TWh, +8.7%)
--- #5. Canada (150.3 TWh, +18.8%)
1954 was a big year for oil, with the U.S. creating a consortium of companies to manage the Iranian industry after unseating then-Prime Minister Mohammad Mossadeq the year before. Meanwhile, on U.S. soil, June of 1954 marked the creation of a launched from a Louisiana shipyard, which would become famously branded Mr. Charlie, First Mobile Offshore Drilling Rig.
1955
- Average barrel of U.S. crude oil: $2.77 (-0.4% change from previous year)
- Inflation adjusted: $26.61 (+0.0%)
- Top oil producers:
--- #1. United States (3,904.7 TWh, +7.3% change from previous year)
--- #2. Soviet Union (823.3 TWh, +19.4%)
--- #3. Kuwait (640.9 TWh, +15.0%)
--- #4. Iraq (386.6 TWh, +8.5%)
--- #5. Canada (202.5 TWh, +34.7%)
The U.S. bounced back from a one-year dip in production, thanks to North Dakota's wells exceeding 1 million barrels per day for the first time in July. 1955 would be the one-year lead-up to the Suez Crisis, when President Dwight D. Eisenhower would have to make some weighty decisions after the Iranian crisis to keep U.S. oil prices stable while maintaining peace during the turmoil.
1956
- Average barrel of U.S. crude oil: $2.79 (+0.7% change from previous year)
- Inflation adjusted: $26.41 (-0.8%)
- Top oil producers:
--- #1. United States (4,113.5 TWh, +5.3% change from previous year)
--- #2. Soviet Union (974.7 TWh, +18.4%)
--- #3. Kuwait (645.5 TWh, +0.7%)
--- #4. Iraq (366.1 TWh, -5.3%)
--- #5. Canada (269.0 TWh, +32.9%)
when Britain, France, and Israel temporarily seized the Suez Canal in retaliation for Egypt's President Gamal Abdel Nasser's nationalizing of the 120-mile waterway, heavily used to ship up to 800,000 barrels of Middle East oil to Europe daily. President Dwight D. Eisenhower made it clear that allies of the North Atlantic Treaty Organization, specifically Israel, must cease fighting, or the U.S would halt relations with them.
1957
- Average barrel of U.S. crude oil: $3.09 (+10.8% change from previous year)
- Inflation adjusted: $28.31 (+7.2%)
- Top oil producers:
--- #1. United States (4,112.9 TWh, 0.0% change from previous year)
--- #2. Soviet Union (1,143.8 TWh, +17.3%)
--- #3. Kuwait (680.8 TWh, +5.5%)
--- #4. Canada (284.5 TWh, +5.7%)
--- #5. Iraq (255.8 TWh, -30.1%)
in the U.S.'s most northwestern region since 1902 gave Alaska more oil clout in 1957, with its 900 barrels a day production. Found by Richfield Oil Corporation, the discovery would be just what Alaska needed to be considered an official member of the 52-state American family by 1959.
1958
- Average barrel of U.S. crude oil: $3.01 (-2.6% change from previous year)
- Inflation adjusted: $26.81 (-5.3%)
- Top oil producers:
--- #1. United States (3,849.0 TWh, -6.4% change from previous year)
--- #2. Soviet Union (1,316.7 TWh, +15.1%)
--- #3. Kuwait (834.4 TWh, +22.6%)
--- #4. Iraq (416.6 TWh, +62.8%)
--- #5. Canada (258.9 TWh, -9.0%)
This year marked the first year of export for the notable Nigerian oil discovery made two years earlier in 1956 at the . The 5.31 square-mile field, branded after a local creek, would flow oil through pipes laid by Royal Dutch Shell until 1978, when the well would go dry, after producing 20 million barrels.
1959
- Average barrel of U.S. crude oil: $2.90 (-3.7% change from previous year)
- Inflation adjusted: $25.66 (-4.3%)
- Top oil producers:
--- #1. United States (4,046.4 TWh, +5.1% change from previous year)
--- #2. Soviet Union (1,506.7 TWh, +14.4%)
--- #3. Kuwait (838.0 TWh, +0.4%)
--- #4. Iraq (487.8 TWh, +17.1%)
--- #5. Canada (289.0 TWh, +11.7%)
Another oil glut caused global concern in the U.S., creating the Mandatory Oil Import Program, which came under President Dwight D. Eisenhower's administration. The capped quota for imports, which favored Canada and Mexico, was based on how much oil the U.S. used, and no more than 9% of homeland consumption was allowed to be imported.
1960
- Average barrel of U.S. crude oil: $2.88 (-0.7% change from previous year)
- Inflation adjusted: $25.05 (-2.4%)
- Top oil producers:
--- #1. United States (4,047.0 TWh, +0.0% change from previous year)
--- #2. Soviet Union (1,719.6 TWh, +14.1%)
--- #3. Kuwait (986.5 TWh, +17.7%)
--- #4. Iraq (552.0 TWh, +13.2%)
--- #5. Canada (296.7 TWh, +2.6%)
With the oil price at the highest it had ever been in September 1960, the formed to protect oil pricing. OPEC's formation came only months after officials from 80% of the world's oil exporters—from Saudi Arabia, Venezuela, Kuwait, and Iran—met in Baghdad.
1961
- Average barrel of U.S. crude oil: $2.89 (+0.3% change from previous year)
- Inflation adjusted: $24.88 (-0.7%)
- Top oil producers:
--- #1. United States (4,120.5 TWh, +1.8% change from previous year)
--- #2. Soviet Union (1,931.4 TWh, +12.3%)
--- #3. Kuwait (1,010.7 TWh, +2.5%)
--- #4. Iraq (569.6 TWh, +3.2%)
--- #5. Canada (345.7 TWh, +16.5%)
The goal of forming OPEC the prior year was to foster some secure oil future after the . However, OPEC's ultimate goal to take on the —a group of transnational oil companies also called Consortium for Iran—was to no avail this year, but would prove to influence the 1973 oil crisis.
1962
- Average barrel of U.S. crude oil: $2.90 (+0.3% change from previous year)
- Inflation adjusted: $24.72 (-0.7%)
- Top oil producers:
--- #1. United States (4,206.1 TWh, +2.1% change from previous year)
--- #2. Soviet Union (2,166.0 TWh, +12.1%)
--- #3. Kuwait (1,141.4 TWh, +12.9%)
--- #4. Iraq (571.8 TWh, +0.4%)
--- #5. Canada (382.2 TWh, +10.6%)
In 1962, his findings of a bell-curve model of peak oil, which predicted that the finite amount of oil in any given field follows a rate of discovery, inevitably causing a maxim that will undoubtedly decline.
1963
- Average barrel of U.S. crude oil: $2.89 (-0.3% change from previous year)
- Inflation adjusted: $24.31 (-1.6%)
- Top oil producers:
--- #1. United States (4,326.4 TWh, +2.9% change from previous year)
--- #2. Soviet Union (2,396.6 TWh, +10.6%)
--- #3. Kuwait (1,223.4 TWh, +7.2%)
--- #4. Iraq (659.1 TWh, +15.3%)
--- #5. Canada (403.0 TWh, +5.4%)
Europe's largest natural gas field, discovered in 1959, would not be respected until 1963 when production began. The type of gas found in the Netherlands Groningen gas field was unique, with than other gases, and was called low calorific, based on its elements.
1964
- Average barrel of U.S. crude oil: $2.88 (-0.3% change from previous year)
- Inflation adjusted: $23.92 (-1.6%)
- Top oil producers:
--- #1. United States (4,380.0 TWh, +1.2% change from previous year)
--- #2. Soviet Union (2,600.5 TWh, +8.5%)
--- #3. Kuwait (1,346.7 TWh, +10.1%)
--- #4. Iraq (716.7 TWh, +8.7%)
--- #5. Libya (481.6 TWh, +85.9%)
which restricted oil drilling in the British Isles region, also gave credence to the U.K., applying international law to acknowledge the region's right to claim natural resources and subsoil from the worldwide seabed as other countries could. Meanwhile, America's oil prices stayed stable as the U.S. passed , addressing state and federal discrimination, and President Lyndon B. Johnson declared war on poverty.
1965
- Average barrel of U.S. crude oil: $2.86 (-0.7% change from previous year)
- Inflation adjusted: $23.37 (-2.3%)
- Top oil producers:
--- #1. United States (4,966.0 TWh, +13.4% change from previous year)
--- #2. Soviet Union (2,824.8 TWh, +8.6%)
--- #3. Venezuela (2,137.8 TWh, not available)
--- #4. Kuwait (1,381.9 TWh, +2.6%)
--- #5. Saudi Arabia (1,289.1 TWh, not available)
Though the American geophysicist M. King Hubbert predicted that worldwide oil production would peak from 1965 to 1971, . would start documenting data from this year through today.
1966
- Average barrel of U.S. crude oil: $2.88 (+0.7% change from previous year)
- Inflation adjusted: $22.88 (-2.1%)
- Top oil producers:
--- #1. United States (5,277.7 TWh, +6.3% change from previous year)
--- #2. Soviet Union (3,083.4 TWh, +9.2%)
--- #3. Venezuela (2,075.9 TWh, -2.9%)
--- #4. Saudi Arabia (1,520.7 TWh, +18.0%)
--- #5. Kuwait (1,457.9 TWh, +5.5%)
Though the would prove dry this year, it would not remain that way, building a lucrative history after the initial 1966 attempt. The accumulated resources that would come from that well between 1966 and 2019 would exceedingly rise, putting the Scandinavian country on the oil map.
1967
- Average barrel of U.S. crude oil: $2.92 (+1.4% change from previous year)
- Inflation adjusted: $22.51 (-1.6%)
- Top oil producers:
--- #1. United States (5,622.4 TWh, +6.5% change from previous year)
--- #2. Soviet Union (3,350.2 TWh, +8.7%)
--- #3. Venezuela (2,182.0 TWh, +5.1%)
--- #4. Saudi Arabia (1,640.5 TWh, +7.9%)
--- #5. Iran (1,515.3 TWh, +22.1%)
, called the Six-Day War, with Israel versus Egypt, Syria, and Jordan, halted all oil supply to the U.S. and Britain. Though the Middle East cut off U.S. supply, a flood of oil in America makes up for the loss, inevitably causing oil overflow rather than drought by an embargo that was soon lifted.
1968
- Average barrel of U.S. crude oil: $2.94 (+0.7% change from previous year)
- Inflation adjusted: $21.75 (-3.4%)
- Top oil producers:
--- #1. United States (5,839.0 TWh, +3.9% change from previous year)
--- #2. Soviet Union (3,595.4 TWh, +7.3%)
--- #3. Venezuela (2,226.6 TWh, +2.0%)
--- #4. Saudi Arabia (1,790.7 TWh, +9.2%)
--- #5. Iran (1,657.8 TWh, +9.4%)
The discovery of Alaskan North Slope oil put the most-isolated U.S. state on the oil map forever. would become the largest in North America, at 213,543 acres. The North Slope has double the amount of found oil in the second-largest U.S. oil field of East Texas.
1969
- Average barrel of U.S. crude oil: $3.09 (+5.1% change from previous year)
- Inflation adjusted: $21.68 (-0.3%)
- Top oil producers:
--- #1. United States (5,937.4 TWh, +1.7% change from previous year)
--- #2. Soviet Union (3,819.0 TWh, +6.2%)
--- #3. Venezuela (2,215.5 TWh, -0.5%)
--- #4. Iran (1,965.3 TWh, +18.5%)
--- #5. Saudi Arabia (1,889.7 TWh, +5.5%)
Norway would continue to swell oil from its surfaces with the . Called the "Super Giant," the well in the North Sea was discovered by Phillips Petroleum Company and remains one of the Scandinavian country's to date.
1970
- Average barrel of U.S. crude oil: $3.18 (+2.9% change from previous year)
- Inflation adjusted: $21.10 (-2.7%)
- Top oil producers:
--- #1. United States (6,194.4 TWh, +4.3% change from previous year)
--- #2. Soviet Union (4,105.8 TWh, +7.5%)
--- #3. Venezuela (2,290.2 TWh, +3.4%)
--- #4. Iran (2,236.2 TWh, +13.8%)
--- #5. Saudi Arabia (2,231.3 TWh, +18.1%)
By 1970, OPEC and its five ruling nations, Saudi Arabia, Venezuela, Kuwait, Iraq, and Iran, had more undeniable power than when it formed in 1960, supply. Within three years, by 1973, oil consumption and demand in the non-communist regions were at 44 million gallons a day, more than double the amount recorded when OPEC formed.
1971
- Average barrel of U.S. crude oil: $3.39 (+6.6% change from previous year)
- Inflation adjusted: $21.55 (+2.1%)
- Top oil producers:
--- #1. United States (6,106.1 TWh, -1.4% change from previous year)
--- #2. Soviet Union (4,385.4 TWh, +6.8%)
--- #3. Saudi Arabia (2,795.9 TWh, +25.3%)
--- #4. Iran (2,655.3 TWh, +18.7%)
--- #5. Venezuela (2,204.7 TWh, -3.7%)
Shell CEO David Barran noted that the five-country organization after the Tehran Agreement of 1971. The Tripoli Agreement, enacted two months later, gave OPEC additional profit.
1972
- Average barrel of U.S. crude oil: $3.39 (0.0% change from previous year)
- Inflation adjusted: $20.88 (-3.1%)
- Top oil producers:
--- #1. United States (6,129.4 TWh, +0.4% change from previous year)
--- #2. Soviet Union (4,657.1 TWh, +6.2%)
--- #3. Saudi Arabia (3,532.5 TWh, +26.3%)
--- #4. Iran (2,945.9 TWh, +10.9%)
--- #5. Venezuela (2,018.2 TWh, -8.5%)
one of the globe's top fuel basins, began producing oil this year, with up to 17 billion in recoverable oil both past and future. Responsible for one-third of Iraq's total oil supply, with up to 1.5 million barrels a day within 1,000 square miles, this field would stay on the top global producer list among fewer than 20 others in 2020.
1973
- Average barrel of U.S. crude oil: $3.89 (+14.7% change from previous year)
- Inflation adjusted: $22.56 (+8.0%)
- Top oil producers:
--- #1. United States (5,975.7 TWh, -2.5% change from previous year)
--- #2. Soviet Union (4,989.7 TWh, +7.1%)
--- #3. Saudi Arabia (4,458.8 TWh, +26.2%)
--- #4. Iran (3,429.7 TWh, +16.4%)
--- #5. Venezuela (2,106.7 TWh, +4.4%)
against the U.S. due to American support of Israel caused a crisis, causing remove limitations on oil imports. Thus was born , a lofty goal to create oil sufficiency within seven years.
1974
- Average barrel of U.S. crude oil: $6.87 (+76.6% change from previous year)
- Inflation adjusted: $35.88 (+59.1%)
- Top oil producers:
--- #1. United States (5,705.8 TWh, -4.5% change from previous year)
--- #2. Soviet Union (5,336.4 TWh, +6.9%)
--- #3. Saudi Arabia (4,988.7 TWh, +11.9%)
--- #4. Iran (3,520.5 TWh, +2.6%)
--- #5. Venezuela (1,865.3 TWh, -11.5%)
In 1974, Arab oil moguls made it clear they would on one condition: the U.S. agrees to help disengage Israel and Syria, explicitly calling for a ceasefire and Israeli concession. Then-U.S. State Secretary Henry Kissinger made it happen, to make peace in the oil industry.
1975
- Average barrel of U.S. crude oil: $7.67 (+11.6% change from previous year)
- Inflation adjusted: $36.70 (+2.3%)
- Top oil producers:
--- #1. Soviet Union (5,708.0 TWh, +7.0% change from previous year)
--- #2. United States (5,454.6 TWh, -4.4%)
--- #3. Saudi Arabia (4,172.3 TWh, -16.4%)
--- #4. Iran (3,128.8 TWh, -11.1%)
--- #5. Venezuela (1,475.7 TWh, -20.9%)
the U.S. dropped the speed limit from 70 mph to 55 mph to save fuel. The Energy Policy and Conservation Act of 1975 demanded better fuel efficiency for new cars, as U.S. citizens consumed millions of oil barrels daily.
1976
- Average barrel of U.S. crude oil: $8.19 (+6.8% change from previous year)
- Inflation adjusted: $37.06 (+1.0%)
- Top oil producers:
--- #1. Soviet Union (6,046.2 TWh, +5.9% change from previous year)
--- #2. United States (5,317.7 TWh, -2.5%)
--- #3. Saudi Arabia (5,077.1 TWh, +21.7%)
--- #4. Iran (3,448.1 TWh, +10.2%)
--- #5. Venezuela (1,449.2 TWh, -1.8%)
in 1976, the country had over its fuel source prices. The country would begin to collect oil profits based on the new government legislation, which further solidified Venezuela's hand in the oil game.
1977
- Average barrel of U.S. crude oil: $8.57 (+4.6% change from previous year)
- Inflation adjusted: $36.41 (-1.7%)
- Top oil producers:
--- #1. Soviet Union (6,347.6 TWh, +5.0% change from previous year)
--- #2. Saudi Arabia (5,438.6 TWh, +7.1%)
--- #3. United States (5,373.7 TWh, +1.1%)
--- #4. Iran (3,316.5 TWh, -3.8%)
--- #5. Venezuela (1,410.6 TWh, -2.7%)
This year President Jimmy Carter , placing all federal agencies under one cabinet-level umbrella that proposes a set of fuel conservation programs. Along with power production, the Department of Energy (DOE) would also , including radioactive waste disposal, reactors, and weapon manufacturing.
1978
- Average barrel of U.S. crude oil: $9.00 (+5.0% change from previous year)
- Inflation adjusted: $35.54 (-2.4%)
- Top oil producers:
--- #1. Soviet Union (6,646.9 TWh, +4.7% change from previous year)
--- #2. United States (5,622.2 TWh, +4.6%)
--- #3. Saudi Arabia (4,928.2 TWh, -9.4%)
--- #4. Iran (3,074.9 TWh, -7.3%)
--- #5. Iraq (1,469.7 TWh, +9.1%)
caused an acute crisis, with the country ceasing all production of 5 million barrels daily in protest of Mohammad Reza Shah. The Iranian oil strike equaled a 5% decrease in global output, spurring one of the most notorious U.S. hostage situations ever in 1979, when 63 Americans were taken from the U.S. Embassy in Iran and were held hostage for more than a year.
1979
- Average barrel of U.S. crude oil: $12.64 (+40.4% change from previous year)
- Inflation adjusted: $44.82 (+26.1%)
- Top oil producers:
--- #1. Soviet Union (6,810.2 TWh, +2.5% change from previous year)
--- #2. Saudi Arabia (5,666.4 TWh, +15.0%)
--- #3. United States (5,538.4 TWh, -1.5%)
--- #4. Iraq (1,993.0 TWh, +35.6%)
--- #5. Iran (1,863.4 TWh, -39.4%)
the American public via television about oil shortage and price hikes in July 1979. According to the leader of the free world of the time, Americans were detrimentally feeding "self-indulgence and consumption."
1980
- Average barrel of U.S. crude oil: $21.59 (+70.8% change from previous year)
- Inflation adjusted: $67.46 (+50.5%)
- Top oil producers:
--- #1. Soviet Union (7,003.6 TWh, +2.8% change from previous year)
--- #2. Saudi Arabia (5,919.4 TWh, +4.5%)
--- #3. United States (5,575.6 TWh, +0.7%)
--- #4. Iraq (1,521.9 TWh, -23.6%)
--- #5. Venezuela (1,362.5 TWh, -7.9%)
would nearly double the U.S. dollar price of oil in one year, from $12.64 to $21.59, exacerbating the global crisis. America remained impartial in the conflict, but the 6% reduction in the production and supply of global oil supply caused by the near-decade of the war significantly affected U.S. fuel pricing.
1981
- Average barrel of U.S. crude oil: $31.77 (+47.2% change from previous year)
- Inflation adjusted: $89.98 (+33.4%)
- Top oil producers:
--- #1. Soviet Union (7,069.1 TWh, +0.9% change from previous year)
--- #2. Saudi Arabia (5,879.3 TWh, -0.7%)
--- #3. United States (5,559.4 TWh, -0.3%)
--- #4. Mexico (1,486.2 TWh, +19.4%)
--- #5. Venezuela (1,319.2 TWh, -3.2%)
, Congress mandated the cessation of offshore drilling in California to address environmental concerns, which only exacerbated rising oil prices due to the Iran-Iraq War. President Ronald Reagan deregulated all crude oil pricing, permitting American oil moguls to charge market-level numbers for their fuel.
1982
- Average barrel of U.S. crude oil: $28.52 (-10.2% change from previous year)
- Inflation adjusted: $76.09 (-15.4%)
- Top oil producers:
--- #1. Soviet Union (7,112.4 TWh, +0.6% change from previous year)
--- #2. United States (5,581.7 TWh, +0.4%)
--- #3. Saudi Arabia (3,949.9 TWh, -32.8%)
--- #4. Mexico (1,753.4 TWh, +18.0%)
--- #5. Iran (1,394.4 TWh, +81.5%)
was in full swing by 1982, with prices dropping by the dollar. Caused by industrialized countries' slow economic growth, the excess only got worse year by year, with both the New York Times and Times magazine reporting the arriving abundance had the world swimming in abundant reserves.
1983
- Average barrel of U.S. crude oil: $26.19 (-8.2% change from previous year)
- Inflation adjusted: $67.70 (-11.0%)
- Top oil producers:
--- #1. Soviet Union (7,156.4 TWh, +0.6% change from previous year)
--- #2. United States (5,607.7 TWh, +0.5%)
--- #3. Saudi Arabia (2,789.9 TWh, -29.4%)
--- #4. Mexico (1,708.3 TWh, -2.6%)
--- #5. Iran (1,426.2 TWh, +2.3%)
To counter the oil glut, OPEC reduced oil productionin 1980 until 1986, which is evident in the 1983 price, which could have been much higher than $26.19. Meanwhile, the , not to be seen again until the Great Recession in 2007-2009, had Americans questioning President Ronald Reagan's economic policies.
1984
- Average barrel of U.S. crude oil: $25.88 (-1.2% change from previous year)
- Inflation adjusted: $64.13 (-5.3%)
- Top oil producers:
--- #1. Soviet Union (7,114.2 TWh, -0.6% change from previous year)
--- #2. United States (5,760.7 TWh, +2.7%)
--- #3. Saudi Arabia (2,543.3 TWh, -8.8%)
--- #4. Mexico (1,722.1 TWh, +0.8%)
--- #5. United Kingdom (1,463.8 TWh, +9.7%)
began in 1984, creating one cause for oil price decline, along with less U.S. global demand and "the Reagan Recession." Meanwhile, the Standard Oil Company of California (SOCAL) would purchase Gulf, the nation's fifth-largest petroleum company, to double its global oil presence overnight.
1985
- Average barrel of U.S. crude oil: $24.09 (-6.9% change from previous year)
- Inflation adjusted: $57.64 (-10.1%)
- Top oil producers:
--- #1. Soviet Union (6,296.8 TWh, -11.5% change from previous year)
--- #2. United States (5,790.5 TWh, +0.5%)
--- #3. Saudi Arabia (1,998.0 TWh, -21.4%)
--- #4. Mexico (1,693.5 TWh, -1.7%)
--- #5. United Kingdom (1,481.7 TWh, +1.2%)
for oil consumption, with U.S. fuel economy averaging 28 mpg compared to the 1978 average of 20 mpg. Consumers switching to natural gas instead of oil for heating and electricity also kept consumption lower.
1986
- Average barrel of U.S. crude oil: $12.51 (-48.1% change from previous year)
- Inflation adjusted: $29.39 (-49.0%)
- Top oil producers:
--- #1. Soviet Union (6,516.0 TWh, +3.5% change from previous year)
--- #2. United States (5,600.4 TWh, -3.3%)
--- #3. Saudi Arabia (2,933.0 TWh, +46.8%)
--- #4. Mexico (1,589.4 TWh, -6.2%)
--- #5. China (1,517.5 TWh, +4.6%)
The oil price collapse in 1986, to $12 a barrel, was for 1973-1974 and 1979-1980 price increases. OPEC had to take immediate measures to secure Saudi Arabia and its allies from increasing their oil output to increase their revenues, further decreasing America's oil pricing.
1987
- Average barrel of U.S. crude oil: $15.40 (+23.1% change from previous year)
- Inflation adjusted: $34.90 (+18.8%)
- Top oil producers:
--- #1. Soviet Union (6,612.3 TWh, +1.5% change from previous year)
--- #2. United States (5,425.4 TWh, -3.1%)
--- #3. Saudi Arabia (2,480.2 TWh, -15.4%)
--- #4. Mexico (1,660.8 TWh, +4.5%)
--- #5. China (1,557.5 TWh, +2.6%)
On Jan. 16, the famed Norweigian well Statfjord, discovered in 1979, produced its largest daily volume at 850,204 barrels of oil. Meanwhile, the would begin to deteriorate.
1988
- Average barrel of U.S. crude oil: $12.58 (-18.3% change from previous year)
- Inflation adjusted: $27.38 (-21.6%)
- Top oil producers:
--- #1. Soviet Union (6,604.2 TWh, -0.1% change from previous year)
--- #2. United States (5,330.2 TWh, -1.8%)
--- #3. Saudi Arabia (3,173.4 TWh, +27.9%)
--- #4. Mexico (1,656.8 TWh, -0.2%)
--- #5. China (1,591.3 TWh, +2.2%)
, when the state was responsible for up to 25% of U.S. domestic production. Meanwhile, the Los Angeles Times reports that the Saudi-inspired oil collapse in 1986 caused a greater , pumping the price by more than $3 in one year.
1989
- Average barrel of U.S. crude oil: $15.86 (+26.1% change from previous year)
- Inflation adjusted: $32.93 (+20.3%)
- Top oil producers:
--- #1. Soviet Union (6,412.0 TWh, -2.9% change from previous year)
--- #2. United States (4,981.6 TWh, -6.5%)
--- #3. Saudi Arabia (3,148.6 TWh, -0.8%)
--- #4. Iran (1,670.1 TWh, +22.5%)
--- #5. Mexico (1,661.1 TWh, +0.3%)
spill in 1989, still recalled today, would not only cause significant harm to sea creatures, but the 11 million barrel spill would directly raise the price of oil by more than $3 a barrel. The damage done by the supertanker that hit Prince William Sound reef in Alaska would cost up to $2 billion to clean up and create the Oil Pollution Act the next year regarding policy and funding for future oil spills.
1990
- Average barrel of U.S. crude oil: $20.03 (+26.3% change from previous year)
- Inflation adjusted: $39.45 (+19.8%)
- Top oil producers:
--- #1. Soviet Union (5,990.1 TWh, -6.6% change from previous year)
--- #2. United States (4,837.4 TWh, -2.9%)
--- #3. Saudi Arabia (3,978.5 TWh, +26.4%)
--- #4. Iran (1,890.2 TWh, +13.2%)
--- #5. Mexico (1,685.6 TWh, +1.5%)
More global unrest and another Iraq war would raise the price of oil: Iraq attacked Kuwait in August 1990 over an oil field in Rumaila. the U.S. about the economic threat due to Iraq, spurring him to release 34 million barrels of oil from U.S. reserves in case of a crisis, which never happened, with oil prices dropping during the time.
1991
- Average barrel of U.S. crude oil: $16.54 (-17.4% change from previous year)
- Inflation adjusted: $31.26 (-20.8%)
- Top oil producers:
--- #1. Soviet Union (5,363.7 TWh, -10.5% change from previous year)
--- #2. Saudi Arabia (4,973.6 TWh, +25.0%)
--- #3. United States (4,910.3 TWh, +1.5%)
--- #4. Iran (2,024.6 TWh, +7.1%)
--- #5. Mexico (1,774.4 TWh, +5.3%)
Oil prices dropped more than $3 per U.S. barrel from 1990. Global turmoil was on the rise, and Iraq President destroyed Kuwait oil facilities this year and attacked Saudi Arabia with missiles, with both events declining oil prices over the next few years.
1992
- Average barrel of U.S. crude oil: $15.99 (-3.3% change from previous year)
- Inflation adjusted: $29.34 (-6.2%)
- Top oil producers:
--- #1. Saudi Arabia (5,133.0 TWh, +3.2% change from previous year)
--- #2. United States (4,795.8 TWh, -2.3%)
--- #3. Russia (4,630.6 TWh, -13.7%)
--- #4. Iran (2,039.8 TWh, +0.8%)
--- #5. Mexico (1,776.9 TWh, +0.1%)
In 1992, the Commonwealth of Independent States (CIS) reported that the crude oil price dropped 52% from the prior year, and production from OPEC reached the highest levels since 1982. with the group global states for 15 years.
1993
- Average barrel of U.S. crude oil: $14.25 (-10.9% change from previous year)
- Inflation adjusted: $25.39 (-13.5%)
- Top oil producers:
--- #1. Saudi Arabia (4,984.8 TWh, -2.9% change from previous year)
--- #2. United States (4,609.7 TWh, -3.9%)
--- #3. Russia (4,120.5 TWh, -11.0%)
--- #4. Iran (2,139.9 TWh, +4.9%)
--- #5. Mexico (1,779.7 TWh, +0.2%)
President Bill Clinton and the "Big Three," Ford, Chrysler, and General Motors, to create a billion-dollar brand called Partnership for a New Generation of Vehicles (PNGV), splitting the billion-dollar deal down the middle between the vehicle moguls and the federal government. The partnership to create more fuel-efficient cars in the next decade gave birth to the Sports Utility Vehicle (SUV).
1994
- Average barrel of U.S. crude oil: $13.19 (-7.4% change from previous year)
- Inflation adjusted: $22.91 (-9.7%)
- Top oil producers:
--- #1. Saudi Arabia (5,018.2 TWh, +0.7% change from previous year)
--- #2. United States (4,499.3 TWh, -2.4%)
--- #3. Russia (3,687.4 TWh, -10.5%)
--- #4. Iran (2,147.9 TWh, +0.4%)
--- #5. Mexico (1,790.1 TWh, +0.6%)
almost completely shut down the country's production of more than 1.5 million barrels per day. The two-month strike was in response to military rule and the detention of Moshood Abiola, who was on trial for treason for saying he won the previous year's election. Alaska had the —although drilling wouldn't start for three years—with a 300 million barrel reserve found on the North Slope.
1995
- Average barrel of U.S. crude oil: $14.62 (+10.8% change from previous year)
- Inflation adjusted: $24.70 (+7.8%)
- Top oil producers:
--- #1. Saudi Arabia (5,007.4 TWh, -0.2% change from previous year)
--- #2. United States (4,453.5 TWh, -1.0%)
--- #3. Russia (3,608.1 TWh, -2.2%)
--- #4. Iran (2,153.4 TWh, +0.3%)
--- #5. Venezuela (1,803.5 TWh, +7.5%)
The year marked the first time since 1990 that the price of American oil went up, as the decline in price helped the country battle inflation. Declining Russian oil production helped prices rise, although for the rest of the decade.
1996
- Average barrel of U.S. crude oil: $18.46 (+26.3% change from previous year)
- Inflation adjusted: $30.29 (+22.6%)
- Top oil producers:
--- #1. Saudi Arabia (5,079.1 TWh, +1.4% change from previous year)
--- #2. United States (4,436.1 TWh, -0.4%)
--- #3. Russia (3,516.7 TWh, -2.5%)
--- #4. Iran (2,167.1 TWh, +0.6%)
--- #5. Venezuela (1,917.9 TWh, +6.3%)
In an effort to fight rising gas prices, President Bill Clinton authorized the sale of more than 12 million barrels of oil from the The move raised $227 million and helped curb rising prices.
1997
- Average barrel of U.S. crude oil: $17.23 (-6.7% change from previous year)
- Inflation adjusted: $27.64 (-8.8%)
- Top oil producers:
--- #1. Saudi Arabia (5,016.3 TWh, -1.2% change from previous year)
--- #2. United States (4,411.6 TWh, -0.6%)
--- #3. Russia (3,569.5 TWh, +1.5%)
--- #4. Iran (2,170.8 TWh, +0.2%)
--- #5. Venezuela (1,991.5 TWh, +3.8%)
a global agreement to reduce rising greenhouse gas levels causing climate change, is accepted willingly by world leaders, which held the highest greenhouse emissions. An extension of the 1992 United Nations Framework Convention on Climate Change (UNFCCC), the protocol adopted in Kyoto, Japan, agreed that developed countries bore the burden to reduce gas emissions since they were more responsible for environmental harm.
1998
- Average barrel of U.S. crude oil: $10.87 (-36.9% change from previous year)
- Inflation adjusted: $17.17 (-37.9%)
- Top oil producers:
--- #1. Saudi Arabia (5,170.4 TWh, +3.1% change from previous year)
--- #2. United States (4,274.4 TWh, -3.1%)
--- #3. Russia (3,533.7 TWh, -1.0%)
--- #4. Iran (2,215.3 TWh, +2.0%)
--- #5. Venezuela (2,064.1 TWh, +3.6%)
After a significant decrease in price per barrel from the prior year, the globe's largest private oil companies banded together to , resulting in Exxon and Mobile, Texaco and Chevron, and BP and Amoco.
1999
- Average barrel of U.S. crude oil: $15.56 (+43.1% change from previous year)
- Inflation adjusted: $24.05 (+40.1%)
- Top oil producers:
--- #1. Saudi Arabia (4,743.4 TWh, -8.3% change from previous year)
--- #2. United States (4,094.4 TWh, -4.2%)
--- #3. Russia (3,538.7 TWh, +0.1%)
--- #4. Iran (2,068.1 TWh, -6.6%)
--- #5. Mexico (1,921.5 TWh, -4.6%)
revenues give Venezuela reason to celebrate. Leader Hugo Chavez, who disagrees with the U.S. regarding foreign policy, begins to threaten to cut off the oil supply, turning the blackmail into decade-long intimidation. Meanwhile, the price of crude oil rises by more than $4 a barrel across the Western world
2000
- Average barrel of U.S. crude oil: $26.72 (+71.7% change from previous year)
- Inflation adjusted: $39.95 (+66.1%)
- Top oil producers:
--- #1. Saudi Arabia (5,091.7 TWh, +7.3% change from previous year)
--- #2. United States (4,035.8 TWh, -1.4%)
--- #3. Russia (3,792.8 TWh, +7.2%)
--- #4. Iran (2,225.4 TWh, +7.6%)
--- #5. Mexico (1,977.6 TWh, +2.9%)
The price of U.S. oil eclipsed the $26 mark for the first time since 1983, resulting from in 1999. Kazakhstan made the first major oil discovery of the new century, with the roughly 32-billion barrel in the Caspian Sea.
2001
- Average barrel of U.S. crude oil: $21.84 (-18.3% change from previous year)
- Inflation adjusted: $31.75 (-20.5%)
- Top oil producers:
--- #1. Saudi Arabia (4,966.0 TWh, -2.5% change from previous year)
--- #2. Russia (4,083.4 TWh, +7.7%)
--- #3. United States (4,000.1 TWh, -0.9%)
--- #4. Iran (2,203.8 TWh, -1.0%)
--- #5. Mexico (2,042.0 TWh, +3.3%)
The events of Sept. 11 helped put a temporary halt to the price growth the U.S. had enjoyed the previous two years. The ensuing military actions in the Middle East would help drive the in the next decade.
2002
- Average barrel of U.S. crude oil: $22.51 (+3.1% change from previous year)
- Inflation adjusted: $32.21 (+1.5%)
- Top oil producers:
--- #1. Saudi Arabia (4,529.0 TWh, -8.8% change from previous year)
--- #2. Russia (4,455.1 TWh, +9.1%)
--- #3. United States (3,969.9 TWh, -0.8%)
--- #4. Iran (2,079.8 TWh, -5.6%)
--- #5. Mexico (2,064.7 TWh, +1.1%)
Worldwide supply was lagging behind demand in 2002, as and instability in the Middle East helped prices rebound. , the first legislation aimed at reducing vehicle emissions, was passed in July. In October, both the House and Senate voted to give President George W. Bush one of the world's largest oil producers.
2003
- Average barrel of U.S. crude oil: $27.56 (+22.4% change from previous year)
- Inflation adjusted: $38.56 (+19.7%)
- Top oil producers:
--- #1. Saudi Arabia (5,346.9 TWh, +18.1% change from previous year)
--- #2. Russia (4,943.0 TWh, +11.0%)
--- #3. United States (3,861.3 TWh, -2.7%)
--- #4. Iran (2,346.5 TWh, +12.8%)
--- #5. Mexico (2,185.2 TWh, +5.8%)
The United States officially invaded Iraq in March 2003, for the first time in almost three decades. Despite little infrastructure damage due to war, were repeated and brought much of Iraq's oil production to a halt.
2004
- Average barrel of U.S. crude oil: $36.77 (+33.4% change from previous year)
- Inflation adjusted: $50.11 (+30.0%)
- Top oil producers:
--- #1. Saudi Arabia (5,721.8 TWh, +7.0% change from previous year)
--- #2. Russia (5,379.3 TWh, +8.8%)
--- #3. United States (3,777.8 TWh, -2.2%)
--- #4. Iran (2,424.8 TWh, +3.3%)
--- #5. Mexico (2,206.6 TWh, +1.0%)
the largest oil exporter to the United States, with Canada taking its place in 2004, providing up to 1.6 million barrels daily. Investing in an oil future, Canada heavily developed its oil sands that equaled 15% of the country's crude oil output in 1999 and would surge to 50% by 2010.
2005
- Average barrel of U.S. crude oil: $50.28 (+36.7% change from previous year)
- Inflation adjusted: $66.28 (+32.3%)
- Top oil producers:
--- #1. Saudi Arabia (5,998.6 TWh, +4.8% change from previous year)
--- #2. Russia (5,513.2 TWh, +2.5%)
--- #3. United States (3,587.7 TWh, -5.0%)
--- #4. Iran (2,413.6 TWh, -0.5%)
--- #5. Mexico (2,165.4 TWh, -1.9%)
Rising $13.51 a barrel, the oil price became a thorn in America's side, with renewable fuel support now a vital takeaway of any political conversation regarding the environment. enacted by Congress promised to address a handful of power matters, including energy efficiency; oil and gas; tribal energy; nuclear issues and security; vehicle and motor fuels, including ethanol; energy tax incentives; and climate change technology.
2006
- Average barrel of U.S. crude oil: $59.69 (+18.7% change from previous year)
- Inflation adjusted: $76.23 (+15.0%)
- Top oil producers:
--- #1. Saudi Arabia (5,909.4 TWh, -1.5% change from previous year)
--- #2. Russia (5,646.0 TWh, +2.4%)
--- #3. United States (3,535.6 TWh, -1.5%)
--- #4. Iran (2,445.6 TWh, +1.3%)
--- #5. China (2,145.3 TWh, +1.9%)
the price of crude oil rose almost another $10 by 2006 with no slack in sight, as the U.S. consumed most of it. Two years shy of the all-time global oil industry peak, 2006 would be significant as the closure of the residential housing boom, rise in unemployment, and debt payoff put increased financial pressure on middle-class America.
2007
- Average barrel of U.S. crude oil: $66.52 (+11.4% change from previous year)
- Inflation adjusted: $82.60 (+8.4%)
- Top oil producers:
--- #1. Russia (5,774.6 TWh, +2.3% change from previous year)
--- #2. Saudi Arabia (5,677.1 TWh, -3.9%)
--- #3. United States (3,541.1 TWh, +0.2%)
--- #4. Iran (2,476.1 TWh, +1.3%)
--- #5. China (2,163.4 TWh, +0.8%)
President George W. Bush signed the Energy Independence and Security Act, promising to increase corporate average fuel economy from 27.5 mpg to 35 mpg by 2020. The U.S. promise to improve the standards, set after the 1973 Arab Oil Embargo, to 35 mpg in 2020 was among the first steps by the federal government to reduce gas emissions.
2008
- Average barrel of U.S. crude oil: $94.04 (+41.4% change from previous year)
- Inflation adjusted: $112.45 (+36.1%)
- Top oil producers:
--- #1. Saudi Arabia (5,921.4 TWh, +4.3% change from previous year)
--- #2. Russia (5,738.8 TWh, -0.6%)
--- #3. United States (3,509.1 TWh, -0.9%)
--- #4. Iran (2,501.3 TWh, +1.0%)
--- #5. China (2,211.2 TWh, +2.2%)
The price of oil skyrocketed in 2008, due to increasing consumer demand and stagnant output. Tensions between the United States and Iran, strikes in Brazil, and insecurity helped black gold reach more than
2009
- Average barrel of U.S. crude oil: $56.35 (-40.1% change from previous year)
- Inflation adjusted: $67.62 (-39.9%)
- Top oil producers:
--- #1. Russia (5,821.4 TWh, +1.4% change from previous year)
--- #2. Saudi Arabia (5,329.6 TWh, -10.0%)
--- #3. United States (3,745.6 TWh, +6.7%)
--- #4. Iran (2,406.0 TWh, -3.8%)
--- #5. China (2,200.2 TWh, -0.5%)
The year kicked off with one of the falling more than 12% on Jan. 7. Plummeting consumer demand from the U.S. economic collapse led to an unforeseen stockpile, forcing the price down more than 40% for the year.
2010
- Average barrel of U.S. crude oil: $74.71 (+32.6% change from previous year)
- Inflation adjusted: $88.21 (+30.4%)
- Top oil producers:
--- #1. Russia (5,948.6 TWh, +2.2% change from previous year)
--- #2. Saudi Arabia (5,379.4 TWh, +0.9%)
--- #3. United States (3,868.1 TWh, +3.3%)
--- #4. Iran (2,461.9 TWh, +2.3%)
--- #5. China (2,357.2 TWh, +7.1%)
, caused by the explosion of a deepwater drilling outfit, lasted four months; the same year, President Barack Obama would introduce his administration's energy policies. He immediately banned all offshore drilling to address safety and environmental concerns, while urging America to ease up on oil consumption.
2011
- Average barrel of U.S. crude oil: $95.73 (+28.1% change from previous year)
- Inflation adjusted: $109.57 (+24.2%)
- Top oil producers:
--- #1. Saudi Arabia (6,069.1 TWh, +12.8% change from previous year)
--- #2. Russia (6,031.6 TWh, +1.4%)
--- #3. United States (4,018.0 TWh, +3.9%)
--- #4. Iran (2,467.7 TWh, +0.2%)
--- #5. China (2,355.6 TWh, -0.1%)
in 2011, making it the largest North African reservoir. After almost four years in office, President Barack Obama continues to warn Americans of the ever-changing oil market and the country's dependency on the power source, specifically during the economic recovery, releasing 30 million barrels from American oil reserves to offset Libya's production.
2012
- Average barrel of U.S. crude oil: $94.52 (-1.3% change from previous year)
- Inflation adjusted: $105.99 (-3.3%)
- Top oil producers:
--- #1. Saudi Arabia (6,377.1 TWh, +5.1% change from previous year)
--- #2. Russia (6,116.0 TWh, +1.4%)
--- #3. United States (4,586.5 TWh, +14.1%)
--- #4. China (2,409.1 TWh, +2.3%)
--- #5. Canada (2,180.9 TWh, +7.3%)
The United States boosted oil production by more than 14%, thanks to which reached peak production after their opening in 2006. Kenya would join the with its first discovery of crude in the country's Turkana Region.
2013
- Average barrel of U.S. crude oil: $95.99 (+1.6% change from previous year)
- Inflation adjusted: $106.08 (+0.1%)
- Top oil producers:
--- #1. Saudi Arabia (6,251.6 TWh, -2.0% change from previous year)
--- #2. Russia (6,179.7 TWh, +1.0%)
--- #3. United States (5,207.0 TWh, +13.5%)
--- #4. China (2,437.9 TWh, +1.2%)
--- #5. Canada (2,329.7 TWh, +6.8%)
U.S. oil fields were putting out significantly fewer in 2013 compared to previous years, as hydraulic fracking was breathing new life into drying wells. The aftermath of the Great Recession, along with high gas prices and better fuel efficiency, decreased consumer demand to under 19 million barrels per day—2 million less than 2005.
2014
- Average barrel of U.S. crude oil: $87.39 (-9.0% change from previous year)
- Inflation adjusted: $95.04 (-10.4%)
- Top oil producers:
--- #1. Saudi Arabia (6,314.4 TWh, +1.0% change from previous year)
--- #2. Russia (6,213.2 TWh, +0.5%)
--- #3. United States (6,088.9 TWh, +16.9%)
--- #4. Canada (2,506.0 TWh, +7.6%)
--- #5. China (2,454.9 TWh, +0.7%)
The in the second half of 2014, going from nearly $115 per barrel in June to under $50 just six months later. Fuel efficiency, decreased demand, and at its November meeting—to deter drilling in the U.S.—all helped spur the historic drop.
2015
- Average barrel of U.S. crude oil: $44.39 (-49.2% change from previous year)
- Inflation adjusted: $48.22 (-49.3%)
- Top oil producers:
--- #1. Saudi Arabia (6,595.5 TWh, +4.5% change from previous year)
--- #2. United States (6,583.7 TWh, +8.1%)
--- #3. Russia (6,290.8 TWh, +1.2%)
--- #4. Canada (2,596.5 TWh, +3.6%)
--- #5. China (2,491.3 TWh, +1.5%)
The United States became the world's second-largest oil producer in 2015, trailing only Saudi Arabia in the global market. Surges in supply, saw the oil price nearly cut in half from 2014. Improvements in vehicle fuel efficiency also contributed to the American crude price dropping $43 per barrel.
2016
- Average barrel of U.S. crude oil: $38.29 (-13.7% change from previous year)
- Inflation adjusted: $41.07 (-14.8%)
- Top oil producers:
--- #1. Saudi Arabia (6,812.4 TWh, +3.3% change from previous year)
--- #2. Russia (6,454.6 TWh, +2.6%)
--- #3. United States (6,297.5 TWh, -4.3%)
--- #4. Canada (2,632.6 TWh, +1.4%)
--- #5. Iraq (2,526.7 TWh, +11.2%)
Prices of U.S. oil continued their downward trend, bottoming out at . Prices rebounded as several major producers slowed production, led by a 4% reduction from the United States, which shuttered 106 rigs in February.
2017
- Average barrel of U.S. crude oil: $48.05 (+25.5% change from previous year)
- Inflation adjusted: $50.47 (+22.9%)
- Top oil producers:
--- #1. United States (6,663.9 TWh, +5.8% change from previous year)
--- #2. Saudi Arabia (6,494.3 TWh, -4.7%)
--- #3. Russia (6,436.0 TWh, -0.3%)
--- #4. Canada (2,854.3 TWh, +8.4%)
--- #5. Iran (2,734.3 TWh, +8.9%)
The U.S. became the for the first time since 1974, overtaking Saudi Arabia and Russia. Shale booms in West Texas spurred the U.S. to output almost 11 million barrels per day in June and August. Increased demand from China, and slowed production from OPEC nations, sent the price by the end of the year.
2018
- Average barrel of U.S. crude oil: $61.40 (+27.8% change from previous year)
- Inflation adjusted: $62.95 (+24.7%)
- Top oil producers:
--- #1. United States (7,798.3 TWh, +17.0% change from previous year)
--- #2. Saudi Arabia (6,697.5 TWh, +3.1%)
--- #3. Russia (6,541.1 TWh, +1.6%)
--- #4. Canada (3,115.0 TWh, +9.1%)
--- #5. Iraq (2,635.8 TWh, +2.1%)
President Donald Trump's led the U.S. to set A new discovery along the Texas-New Mexico border in the Permian Basin is thought to contain 46 billion barrels,
2019
- Average barrel of U.S. crude oil: $55.59 (-9.5% change from previous year)
- Inflation adjusted: $55.98 (-11.1%)
- Top oil producers:
--- #1. United States (8,670.2 TWh, +11.2% change from previous year)
--- #2. Russia (6,596.2 TWh, +0.8%)
--- #3. Saudi Arabia (6,462.3 TWh, -3.5%)
--- #4. Canada (3,191.3 TWh, +2.5%)
--- #5. Iraq (2,719.6 TWh, +3.2%)
The United States posted its first month as a in 70 years at the tail end of 2019, spurred by increased production in West Texas and New Mexico. had an adverse effect on the American crude oil price, which tumbled nearly 10%.