
Patent growth by state: What R&D credits donŌĆÖt tell you
When economists talk about American innovation, the conversation usually centers on California, New York, and Texas, the undisputed heavyweights of U.S. patent output. The last three years told a different story.
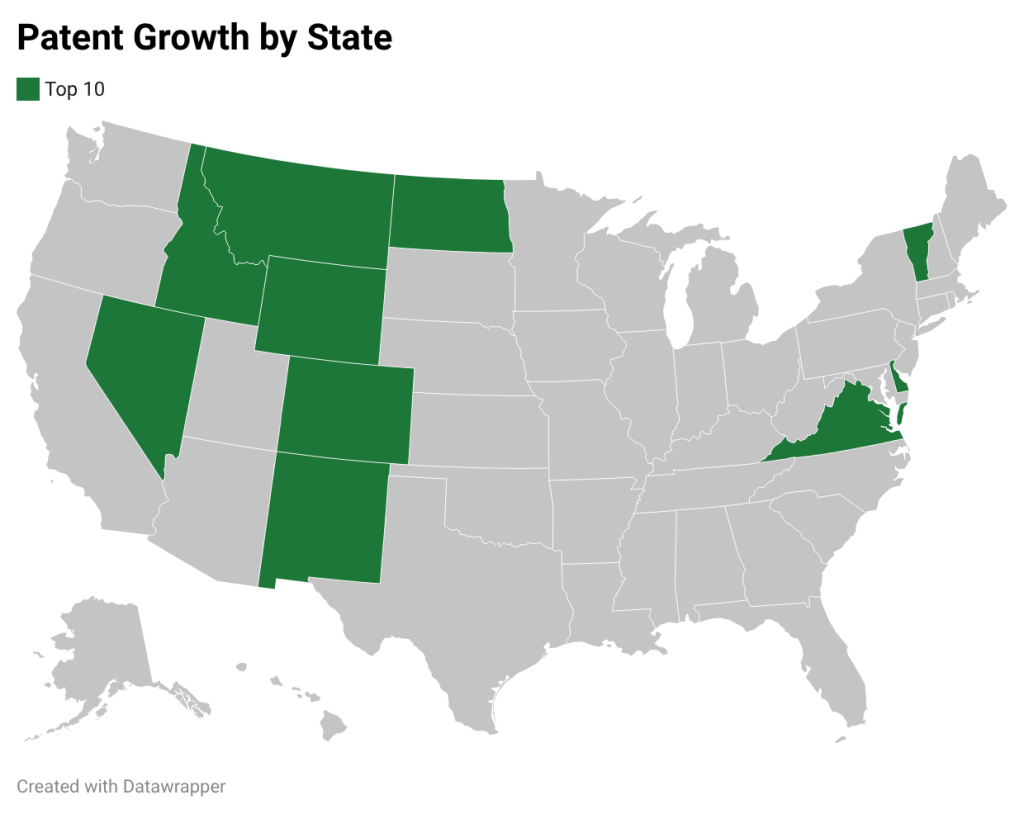
Across the country, the total number of patents issued fell by 8.1% between 2021 and 2024, showing patent applications at their lowest point in years. Only 10 states finished those three years with patent growth. The other 40 lost ground.
A new analysis of USPTO-backed state data, compiled by , ranked all 50 states by three-year patent growth and layered on current state research and development (R&D) credit availability. The result is an innovation scoreboard that challenges conventional wisdom about where momentum lives and what tax incentives may or may not have to do with it.
The three-year window also coincided with one of the more turbulent periods for corporate finance in recent history. Rising interest rates, post-COVID-19 pandemic budget resets, and growing pressure on R&D spending across industries created an uncertain environment. That backdrop makes the states that grew patents despite those headwinds worth examining more closely.
Key Findings
- Only 10 of 50 states posted higher patent issuances in FY2024 than in FY2021, using USPTO-backed state data.
- Montana led all states with 26.2% growth (187 to 236 patents), followed by Nevada at 22.2%.
- Six of the top 10 growth states came from the Mountain/Interior West region.
- Three of the top five fastest-growing states, Montana, Nevada, and Wyoming, had no current state R&D credit in the public source set used for this analysis.
- Seven of the top 10 growth states had both positive patent momentum and a current R&D credit, representing the clearest ŌĆ£innovation + incentiveŌĆØ alignment in the country.
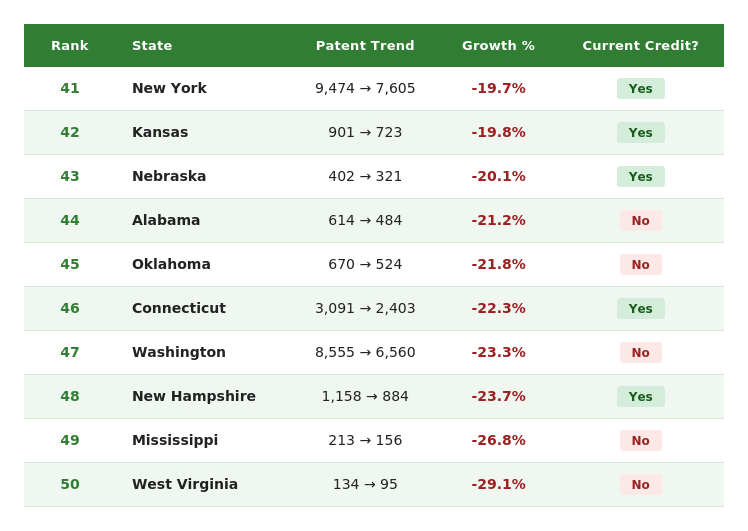
- Washington state posted the largest raw patent loss of any state, shedding 1,995 patents over the period; New York lost 1,869.
- Five of the bottom 10 states still appeared on the R&D credit side of the public map, demonstrating that a credit alone doesnŌĆÖt protect patent momentum.
- Michigan and Texas represent two major policy-watch states, each introducing new R&D credit structures that postdate the FY2021-FY2024 ranking window.
Top 10 states
Table 1. Top 10 states by FY2021 to FY2024 patent growth
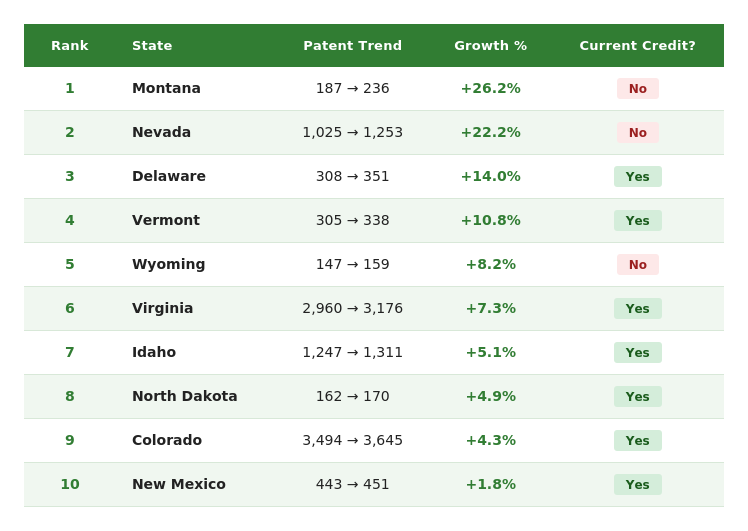
Table 2. Bottom 10 states by FY2021 to FY2024 patent growth
The WestŌĆÖs Quiet Innovation Surge
Innovation was found in unlikely places. Six of the 10 growth states came from the broader western band, including Montana, Nevada, Wyoming, Idaho, Colorado, and New Mexico. None of them are traditional patent powerhouses, yet all of them grew during a period when most of the country was moving in the opposite direction.
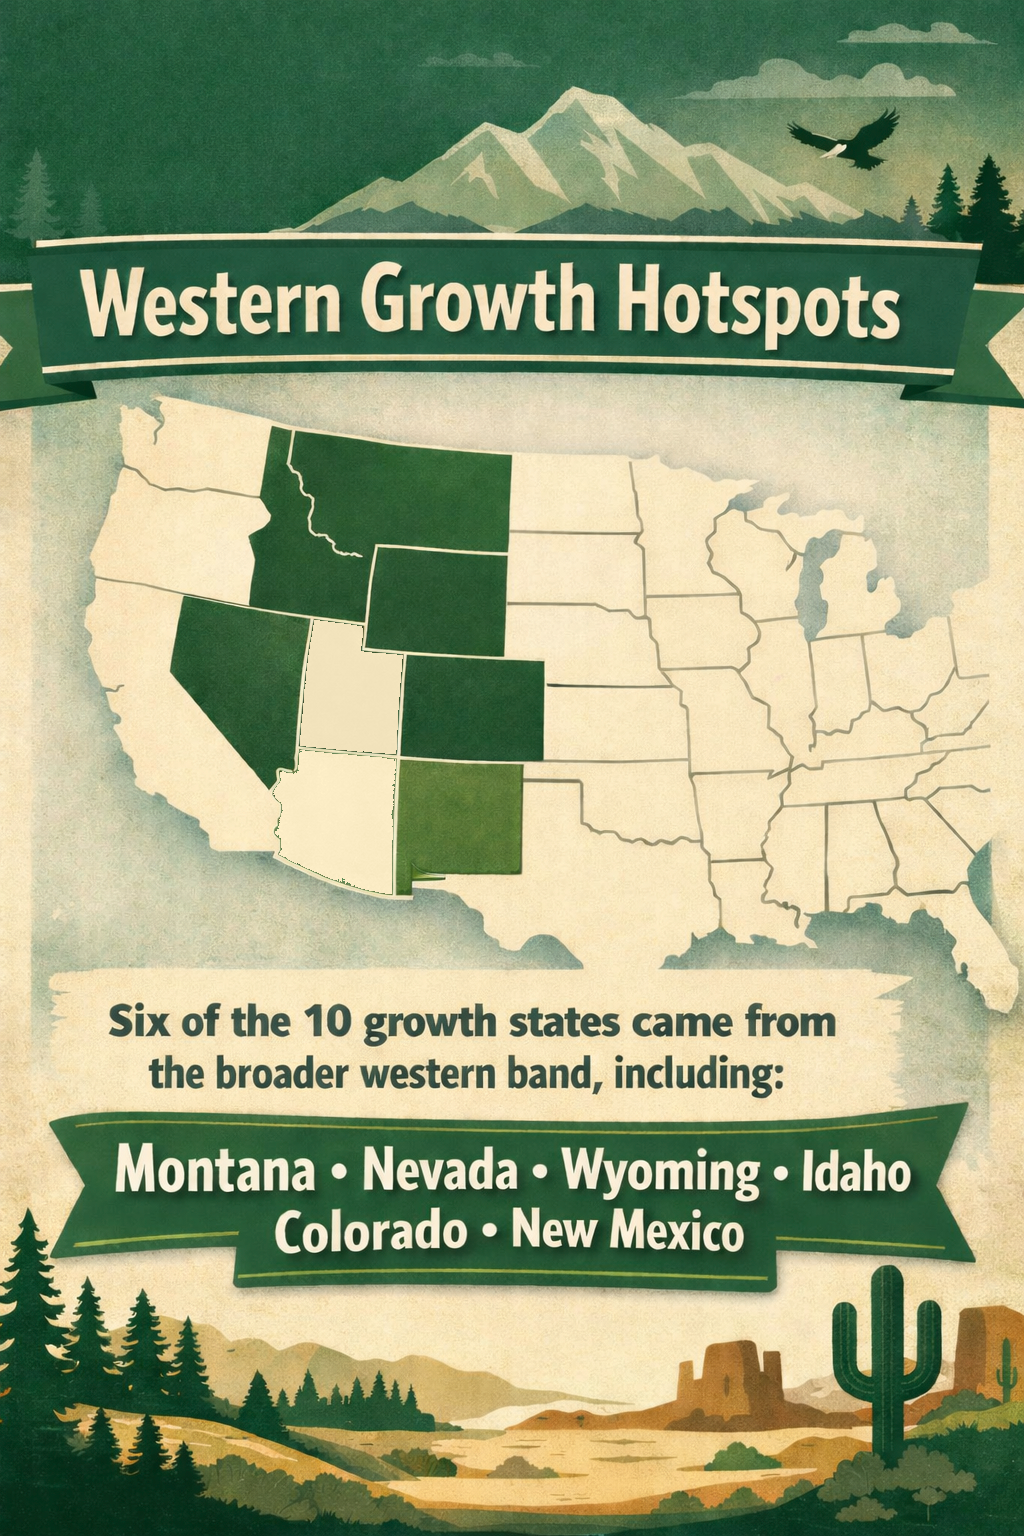
Nevada, the strongest large-base performer among them, grew from 1,025 patents to 1,253, adding 228 in raw terms, the biggest raw gain among all growth states. Colorado, starting from a larger base of 3,494, still managed 4.3% growth to reach 3,645. These states donŌĆÖt have Silicon ValleyŌĆÖs tech campuses or New YorkŌĆÖs financial infrastructure. What they appear to have is something harder to quantify: momentum.
That shift is already showing up in where companies are choosing to locate their operations. over the past decade, Idaho posted the in the country in 2022, and Nevada has become a drawn by both its cost structure and its natural resources. The patent data may simply be the lagging confirmation of a migration that began years earlier.
For CFOs and site-selection teams, this cluster matters. Patent momentum isnŌĆÖt simply following population or existing tech concentration. Something else is shaping the map, and the Mountain West appears to be one of the clearest answers.
The Surprise Twist in the Credit Map
The intuitive assumption is straightforward: States that offer R&D tax credits should produce more patents, because theyŌĆÖre financially rewarding companies for doing research. The data doesnŌĆÖt support that clean connection.
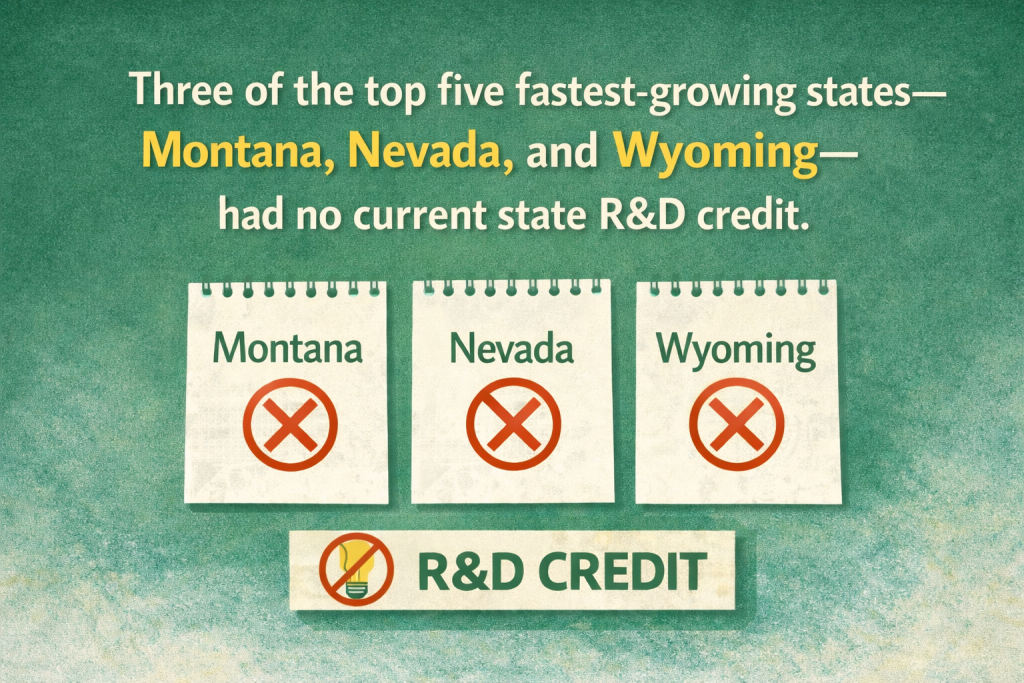
Three of the top five fastest-growing states, Montana, Nevada, and Wyoming, had no current state R&D credit listed in the public source set used for this analysis. Meanwhile, five of the bottom 10 states did appear on the credit side of the map.
Credit structure compounds the problem. is tied to specific geographic enterprise zones, making it far narrower than a broad operating credit. with separate application deadlines and eligibility thresholds. These distinctions are invisible on a simple yes/no credit map, and navigating them requires the kind of state-by-state literacy that most finance teams donŌĆÖt have time to build from scratch.
None of this means credits are unimportant. It means a credit that exists on paper is not the same thing as a credit that drives measurable innovation outcomes. That gap is where the real story lives.
The Policy Lag Problem Nobody Is Talking About
ThereŌĆÖs a more fundamental reason the credit map and the patent map donŌĆÖt align neatly: time.
Any CFO who spent 2022 and 2023 waiting for Congress to restore the federal R&D deduction already understands the policy lag problem intuitively. The decisions companies made while waiting directly affected research budgets that wonŌĆÖt show up in patent counts for years. A patent issued in 2024 could reflect a research decision made in 2020 or 2021, long before many of the credits in this dataset existed in their current form. , which means the research behind a 2024 patent likely began years before filing.
The implication is significant. A tax credit enacted in 2023 may not fund a patent until 2027 or later. Comparing todayŌĆÖs credit map against a three-year patent window isnŌĆÖt measuring the same moment in time. ItŌĆÖs measuring two different points in the same long cycle.
MichiganŌĆÖs 2025 credit and TexasŌĆÖs 2026 credit cannot explain anything in this dataset. Those policies didnŌĆÖt exist during the ranking period. ThatŌĆÖs not a criticism of those states. ItŌĆÖs a reminder that policy takes years to produce measurable outcomes, and any analysis that ignores the timing gap risks drawing the wrong conclusions.
The Giants Stumbled, and the Numbers Are Big
The percentage declines among the countryŌĆÖs largest patent states look manageable on paper. The raw numbers tell a different story.
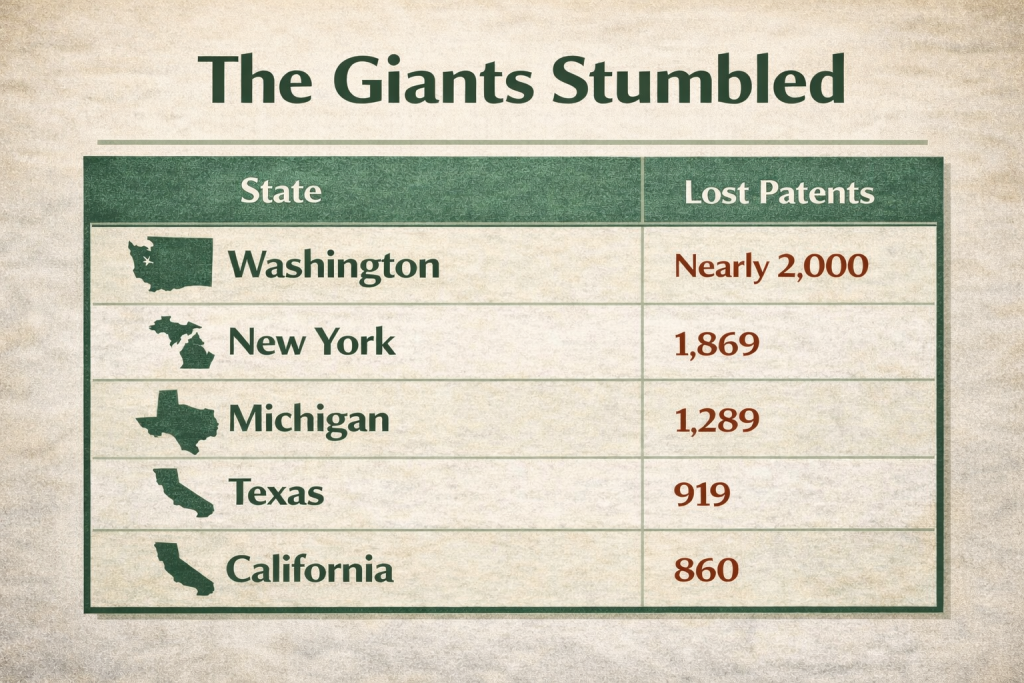
WashingtonŌĆÖs 23% decline translated to nearly 2,000 lost patents. New YorkŌĆÖs 20% drop meant 1,869 fewer innovations entering the public record. MichiganŌĆÖs 18.5% fall cost the state 1,289 patents. Texas shed 919. California dropped 860. Those arenŌĆÖt rounding errors. They represent years of R&D investment that didnŌĆÖt make it to the finish line during this window.
The same period that produced WashingtonŌĆÖs nearly 2,000 patent decline also saw and collectively cut tens of thousands of workers, many of them in the R&D and engineering functions that produce patents. The data and the headlines were telling the same story from different angles.
These states remain enormous in absolute patent volume. CaliforniaŌĆÖs 46,454 patents in FY2024 still dwarfs every other state. But volume tells you about the past. Trajectory tells you about the future. A state can be a dominant force in raw patent counts and still be losing competitive ground at the same time. For large-company tax and innovation strategy teams, that distinction matters more than the leaderboard position.
Two States That Could Look Very Different Next Time
Michigan saw its patent count fall 18.5% over the three-year window, one of the steeper declines in the dataset. At the same time, the state launched a , paired with a $60 million Michigan Innovation Fund, applying to qualifying research expenses above a three-year base amount. The credit earned bipartisan support and broad backing from the stateŌĆÖs life sciences and manufacturing sectors. That policy change postdates the entire ranking window.
Texas followed a similar path. Its patent count fell 7.4% over the period, but the state passed Senate Bill 2206, signed into law in June 2025, permanently extending and enhancing its R&D franchise tax credit effective Jan. 1, 2026. The raises the base rate from 5% to 8.722%, introduces refundability for qualifying entities, and carries no sunset provision. Previous Texas R&D incentives were set to expire. This one isnŌĆÖt.
Neither of those changes could have influenced the ranking they appear in. Future patent rankings will be measured against a meaningfully different incentive backdrop in both states.
Businesses making location and R&D investment decisions today shouldnŌĆÖt judge Michigan or Texas by where they rank right now. The more useful question is whether the policy foundation being built in 2025 and 2026 makes them worth a serious second look over the next decade. On that question, both states have made their intentions clear.
What the Innovation Scoreboard Actually Tells Us
Pull back far enough, and this analysis makes one central argument: The innovation map is more dynamic than most people assume.
The states gaining patent momentum arenŌĆÖt always the ones with the largest economies, the most established tech sectors, or even the most visible incentive programs. Growth came from unexpected corners of the map during a period when 40 states were moving in the wrong direction. The states that dominated patent counts for decades are losing ground in raw numbers, and percentage rankings tend to soften. And the two states that look most like laggards right now are both making deliberate policy moves that could change that story entirely.
The credit picture doesnŌĆÖt simplify things. It complicates them. Some growth states had strong incentives. Some didnŌĆÖt. Some declining states had credits on the books. Others didnŌĆÖt. The timing mismatch between when a credit is enacted and when it shows up in patent counts means any single-period snapshot will always be incomplete.
What this scoreboard actually measures is the accumulated result of thousands of individual research investment decisions made years earlier, by companies, universities, and entrepreneurs responding to conditions that may look nothing like today. The states that will lead the next edition of this ranking are probably already making those decisions right now. The businesses and tax strategists paying attention to where innovation momentum is building, and what incentive environments surround it, will be better positioned to meet them there.
Methodology
Patent data was sourced from the public state table ŌĆ£Patents Issued and Trademarks Registered to U.S. Residents by State, Fiscal Years 2021-2024,ŌĆØ compiled from USPTO Performance and Accountability Reports. Only patent columns were used; trademark data and Washington D.C., were excluded. Three-year growth was calculated as FY2024 patents divided by FY2021 patents, minus 1, ranked highest to lowest. Raw patent counts and compound annual growth rates (CAGR) are included to prevent small-base distortion. R&D credit availability was assessed using public state credit guides and official state tax pages, with recent policy changes verified against the NCSL State Tax Actions Database and individual state treasury sources. This analysis compares patent trends with the current incentive environment; it does not establish causation between credit availability and patent outcomes.
Primary sources: USPTO-backed Kansas Statistical Abstract state patent table; CSSI Services state R&D credit guide; KBKG state benefits list; Tax Point Advisors state credit map; Michigan Treasury (new 2025 credit); Texas Comptroller (2026 Subchapter T credit); Virginia Tax; Colorado DOR Enterprise Zone Tax Guide; NCSL State Tax Actions Database.
was produced by and reviewed and distributed by ┬ķČ╣įŁ┤┤.


