
What 100,000 frontline workers taught us about a $600B problem
When workers don’t show up at their jobsite, it hurts big time. How bad is it? Unplanned absences cost American businesses over annually. But while you can’t eliminate absenteeism entirely, understanding when it’s most likely to happen can help companies plan ahead and sometimes prevent it.
With anonymized data from over 100,000 employees, , an attendance workforce management platform, examined over the past 12 months to identify when absenteeism spikes and what may be driving it.
To help validate the patterns, internal benchmark data was compared with national figures from the .
The average absentee rate among TeamSense users was 2.4%, 15% lower than the BLS-reported average of for the manufacturing sector. While absenteeism has seasonal ebbs and flows, it can be curbed by implementing new workplace programs or introducing effective . And it’s worth it. If the national absenteeism rate improved by just 5%, that would save American companies $30 billion dollars.
The Real-World Data Behind These Absentee Trends
The numbers in this report are derived directly from TeamSense’s internal Absenteeism Benchmarking Report, which draws on anonymized from a diverse range of U.S. companies across manufacturing, warehousing, food production, and logistics. These are real hourly employees working real frontline jobs.
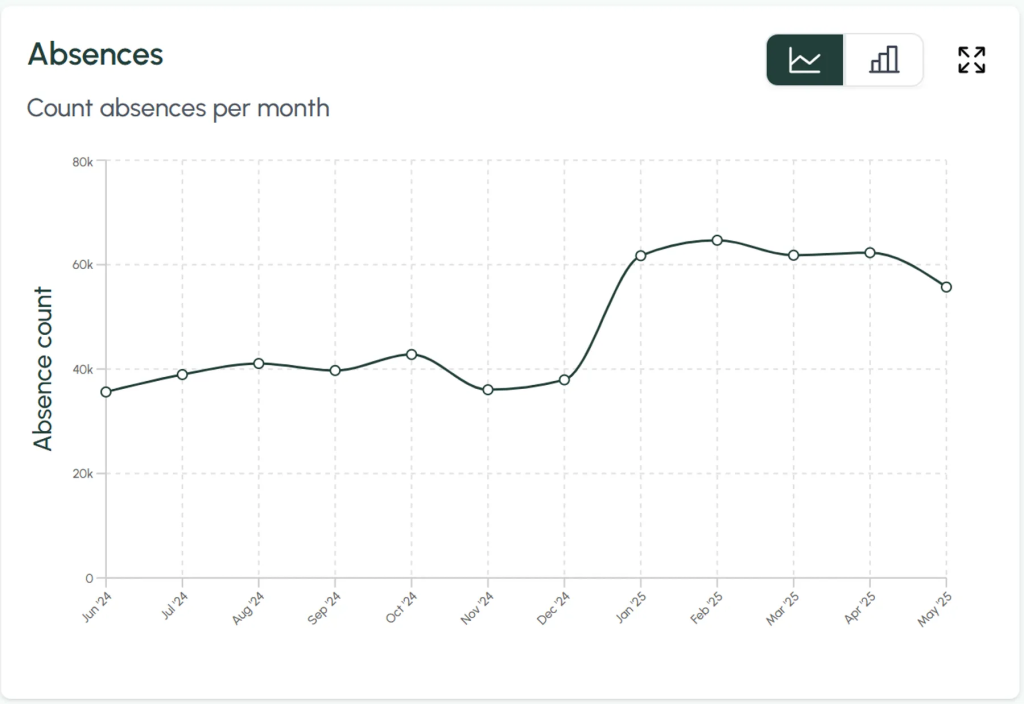
Between June 2024 and May 2025, TeamSense tracked over 100,000 shift-based employees and recorded more than 7 million attendance data points.
The monthly absentee rate was calculated by dividing the number of workers with at least one unplanned absence by the total number of active employees for that month. Those percentages were then used to estimate how many workers missed work across our benchmark population.
This isn't survey data or self-reported estimates; it’s based on verified employee call-offs and absenteeism records.
So, what does the data actually show?
Let’s start with a surprise: the months with the lowest absenteeism rates might not be the ones you’d expect.
When Workers Actually Show Up (and When They Don’t)
Absenteeism isn’t random; it follows a clear seasonal rhythm. There are distinct peaks and valleys in unplanned absences throughout the year.
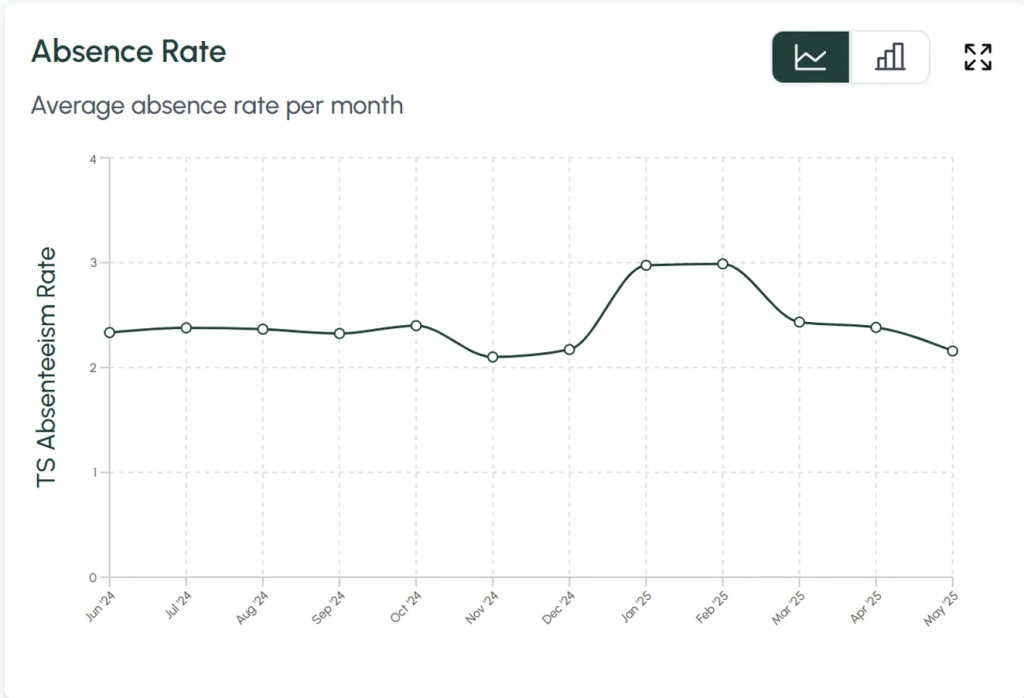
The Most Reliable Months: November, December, and May (2.1%-2.2%)
Surprisingly, some of the busiest months on the calendar are also the months with the lowest absenteeism rates. In November, December, and May, just over 2 out of every 100 workers missed a shift due to an unplanned absence. These months are 13%-17% lower than the average absence rates for the rest of the year.
Why so steady?
- Planned time off reduces surprises. November and December are the most common months for scheduled PTO, especially around Christmas Eve and Christmas Day. About offer Christmas as a paid holiday, according to OnTheClock, and many employees take additional time off, reducing the number of unexpected call-outs.
- Weather and illness don’t hit as hard. In May, weather is milder, flu season hasn’t peaked, and routines are more predictable, leading to fewer disruptions.
The Middle of the Pack: March to October (2.3%-2.4%)
Absenteeism holds relatively steady through the spring, summer, and early fall months. From March through October, unplanned absence rates hovered between 2.3% and 2.4%, a slight increase from the most reliable months, but still fairly predictable.
These months tend to reflect baseline fluctuations driven by personal emergencies, mild illnesses, or vacation hangovers, not large-scale seasonal disruptions.
When Absenteeism Spikes: January and February (3%)
The beginning of the year hits hard. Absenteeism jumps 33% above low-season averages during January and February, and the reasons are familiar but still brutal for scheduling managers.
What’s behind the spike?
- Flu-related illness. The 2024-25 U.S. flu season was one of the worst in years. According to the , there were at least 41 million cases and 540,000 hospitalizations during the season, which reached “high-severity” levels and peaked in February when nearly 49,000 people were hospitalized in a single week.
- Post-holiday burnout. January is a tough reentry point for many workers. A conducted by a workforce management company UKG found that 43% of employees feel more burned out in January than any other month.
- Bad weather. Snowstorms and ice make commuting tough, especially in northern states. School closures also mean many parents are forced to miss work. In January and February 2025 alone, nearly 977,000 U.S. workers missed shifts due to weather, the highest two-month total since 2021.
February: The Worst Month With the Highest Call Outs of the Year
February 2025 showed the highest absence rate, with almost 3% of employees experiencing an unplanned absence at least one day that month, representing a 35% increase from November.
What’s behind this high outage rate? A couple of factors, namely:
- Peak flu rates. As we mentioned, it was a tough year for flu, but February was especially miserable. Flu transmission hit its peak in February, with more than 50,000 patients being admitted to hospitals for influenza during alone.
- Super Bowl hangovers. Turns out, while Super Bowl Sunday is the biggest night of the year for football, the following Monday is the biggest day for employee absences. A 2025 study from UKG found that an estimated planned to skip work on Feb. 9, the day after the Super Bowl — a more than 40% increase from the previous year. While 12.9 million had gotten their time off pre-approved and 4.8 million had swapped shifts with a coworker, the rest planned to call in sick (3.2 million) or simply skip work (another 3.2 million).
Turning Absenteeism Trends Into Action
Absenteeism is always going to happen, but when you know the patterns, you don’t have to be caught off guard.
Seeing when call-outs tend to spike (and why) gives you a real chance to plan ahead, support your team, and keep things running smoothly even during the toughest months. Whether it’s flu season, post-holiday burnout, or surprise snow days, a little foresight goes a long way.
Being able to track and respond to attendance trends in real time doesn’t just reduce disruption; it helps you make smarter staffing decisions all year long. With the right data on your side, tackling absenteeism gets a whole lot easier.
was produced by and reviewed and distributed by Â鶹Դ´.


