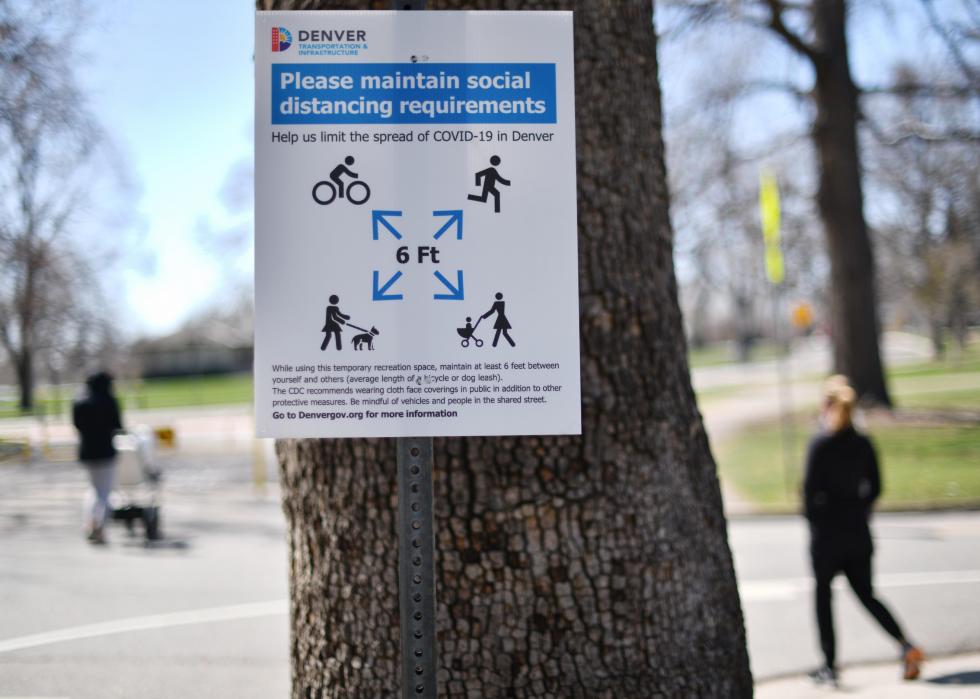
States with the populations most vulnerable to COVID-19
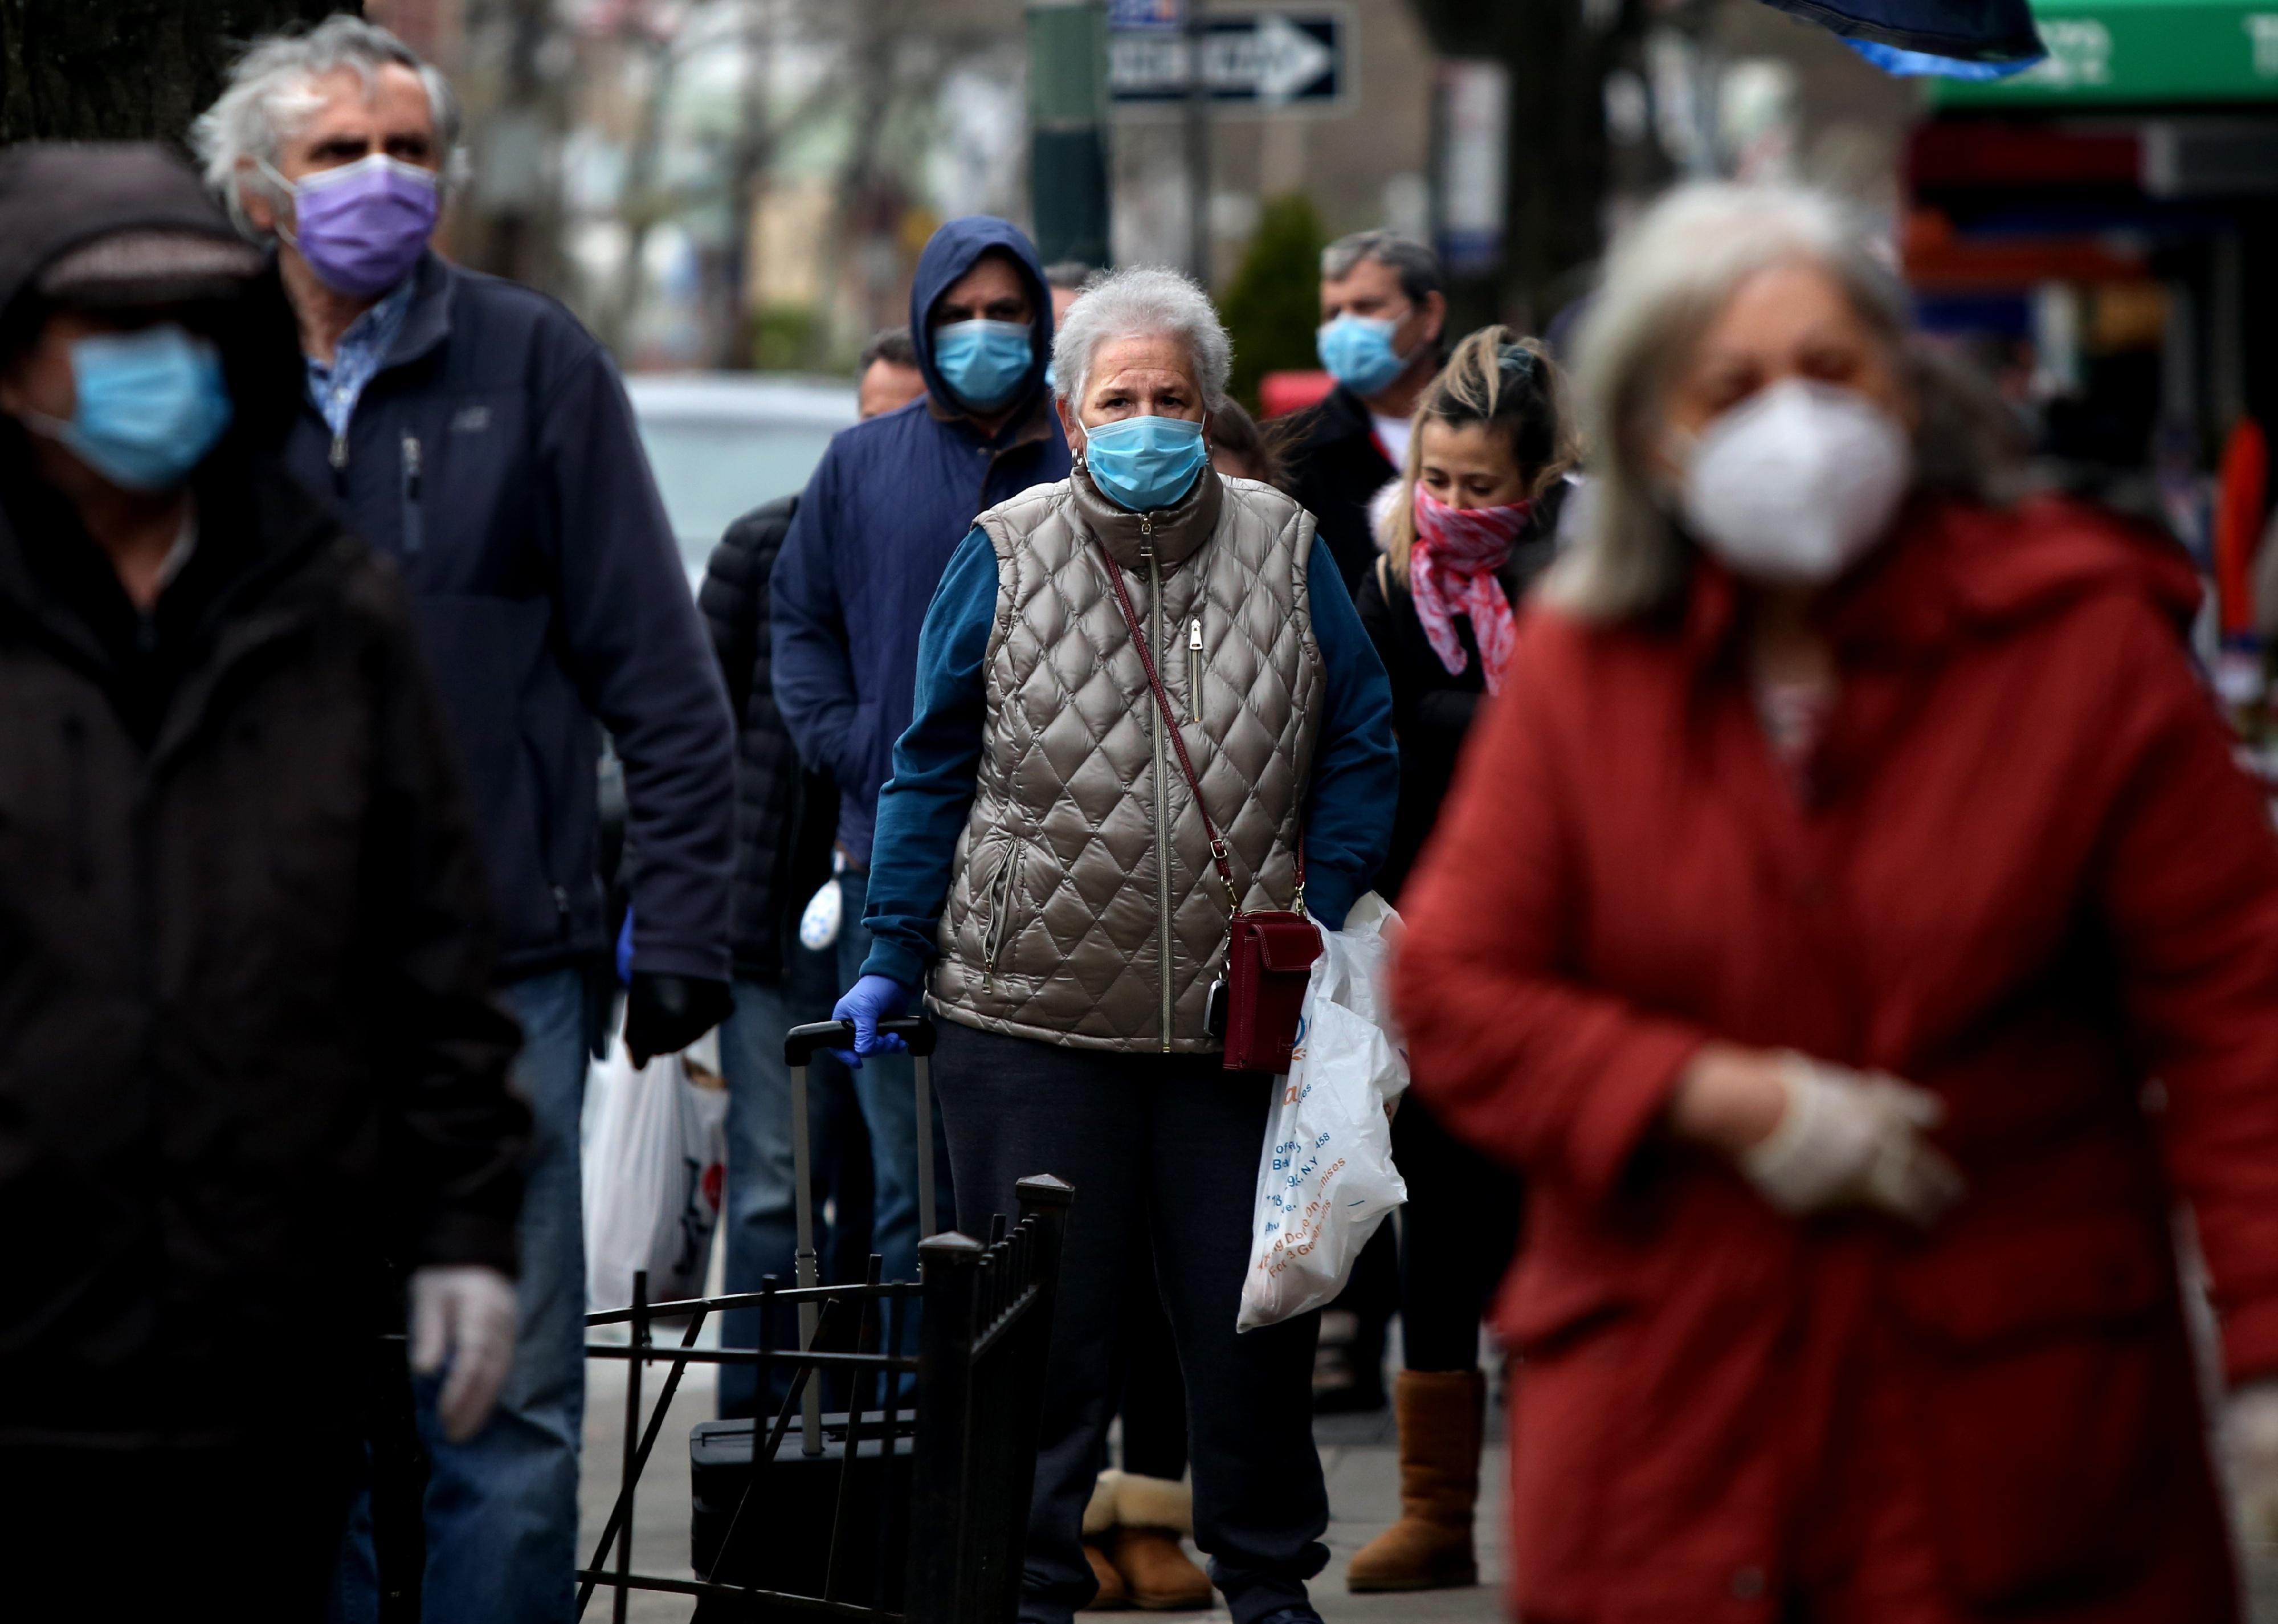
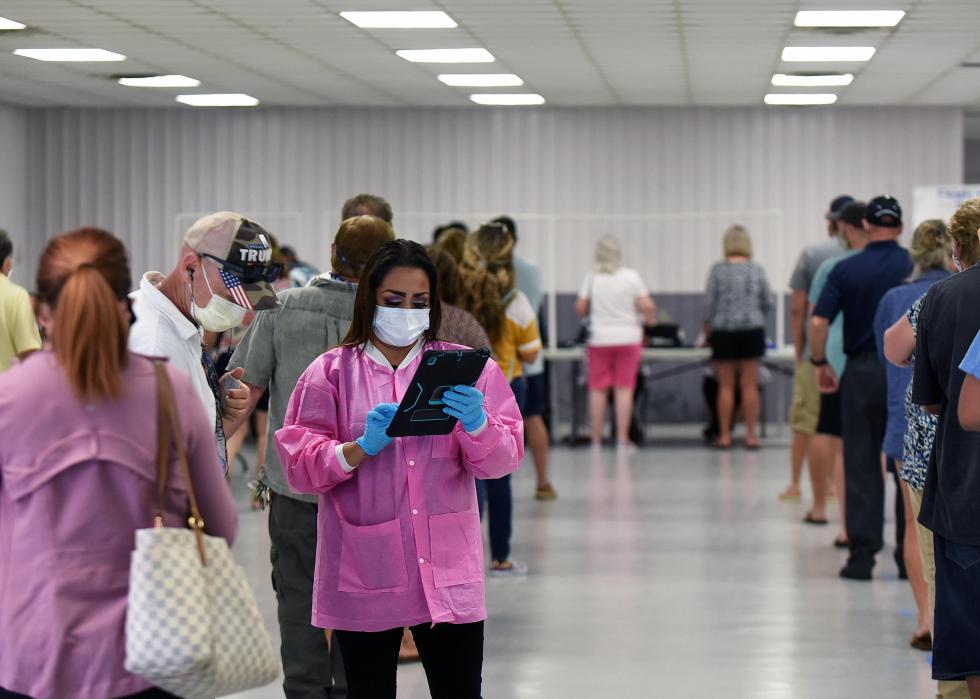
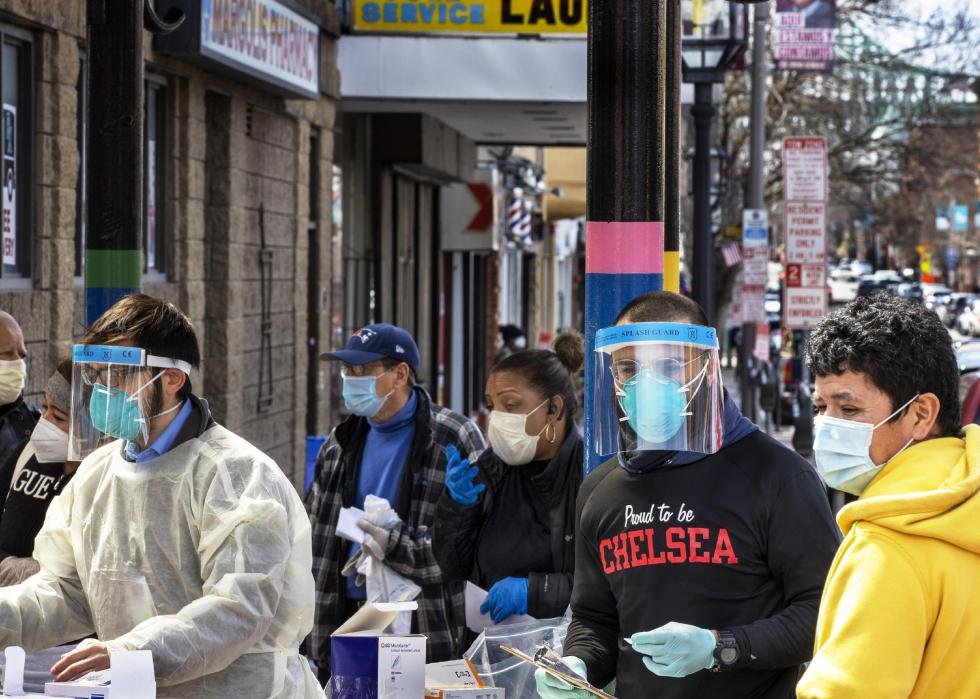
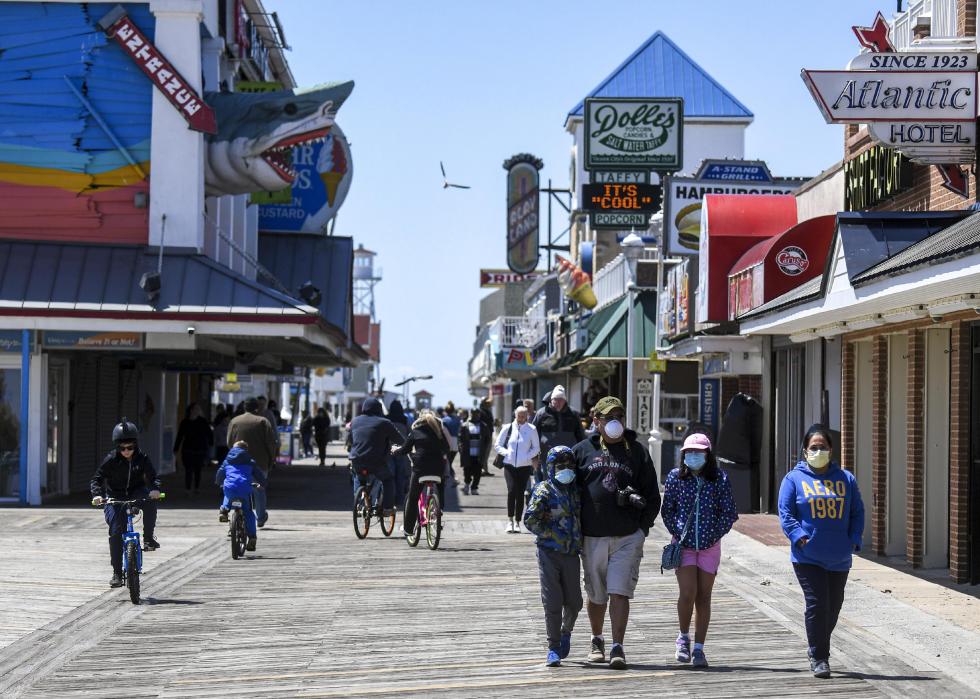
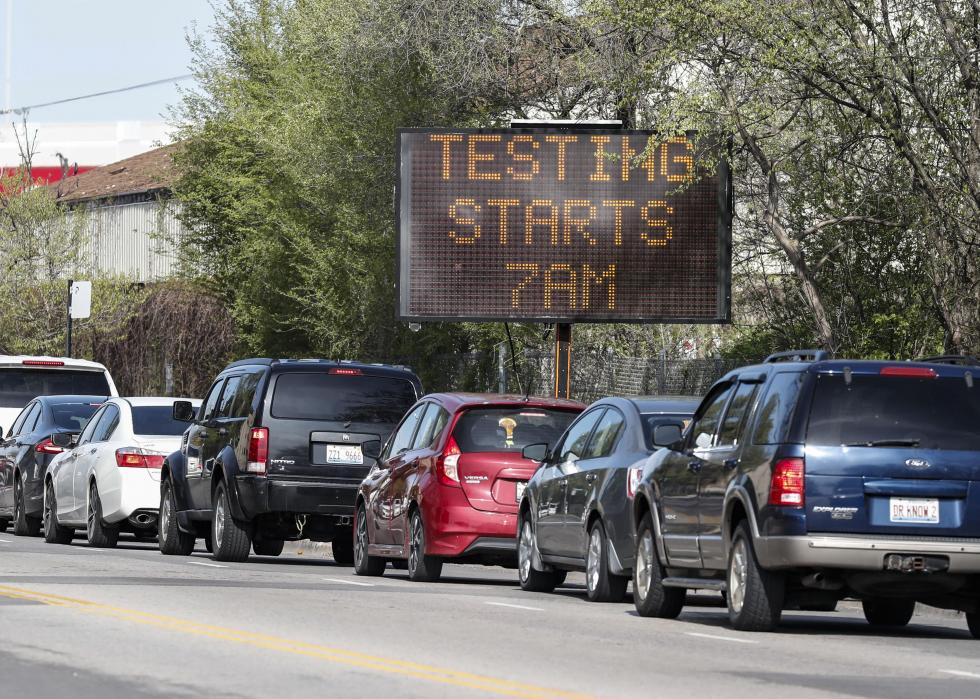
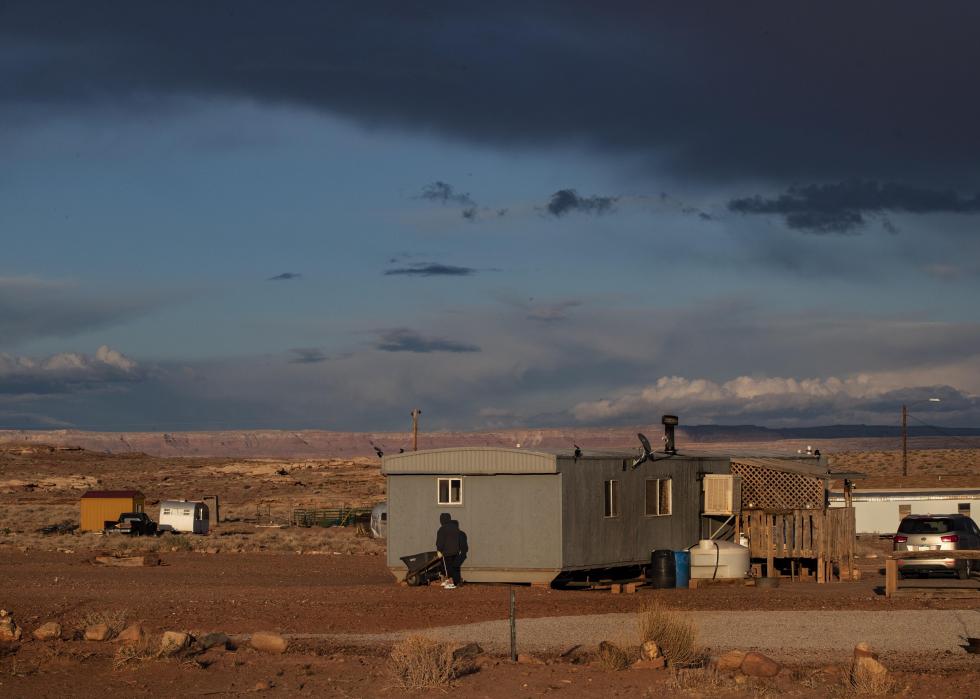
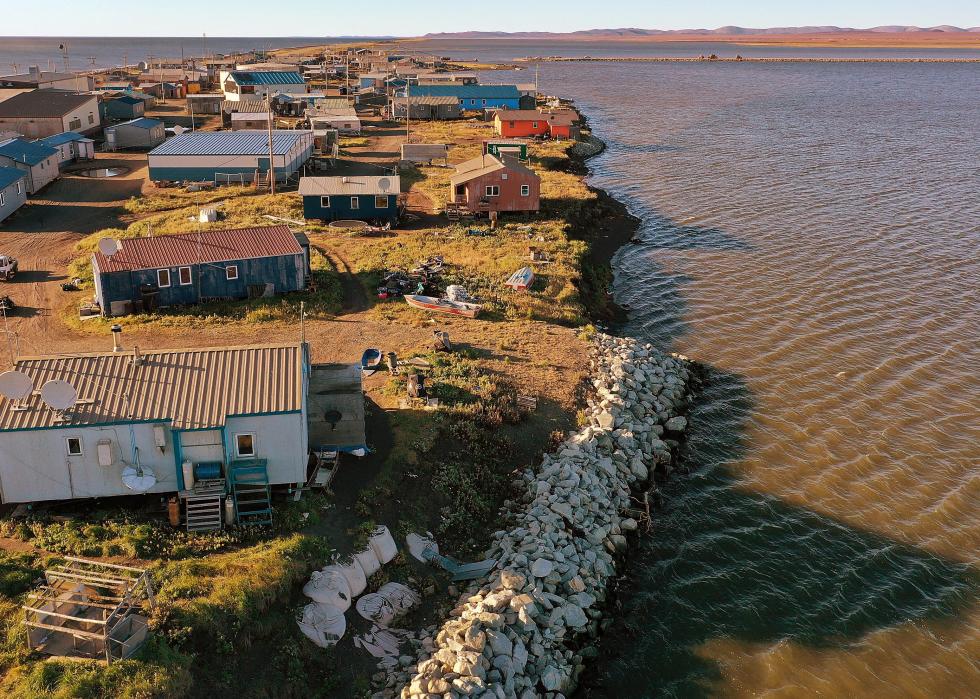
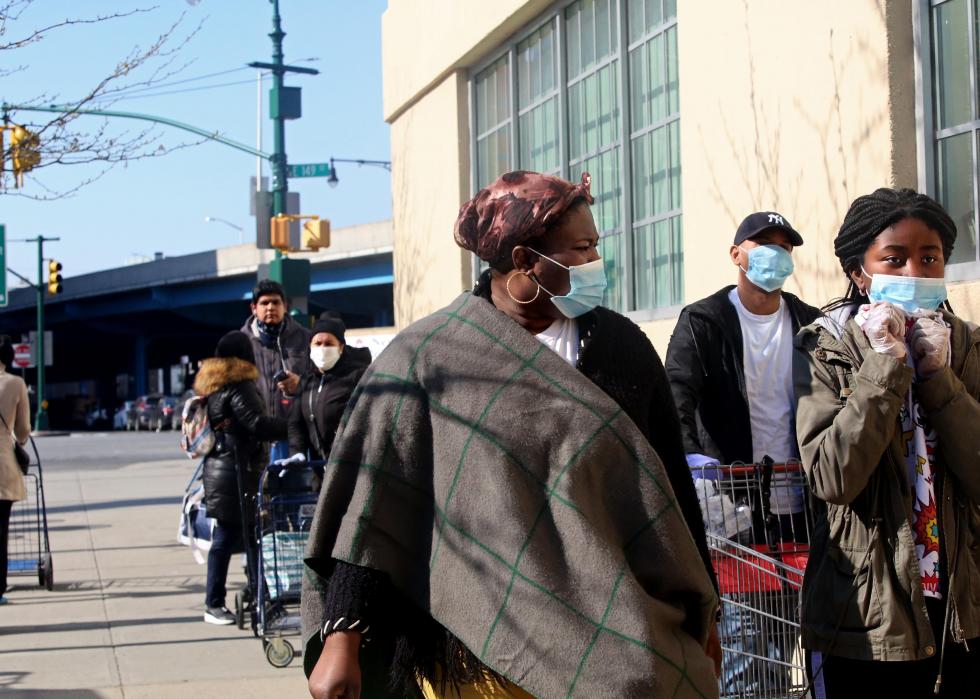
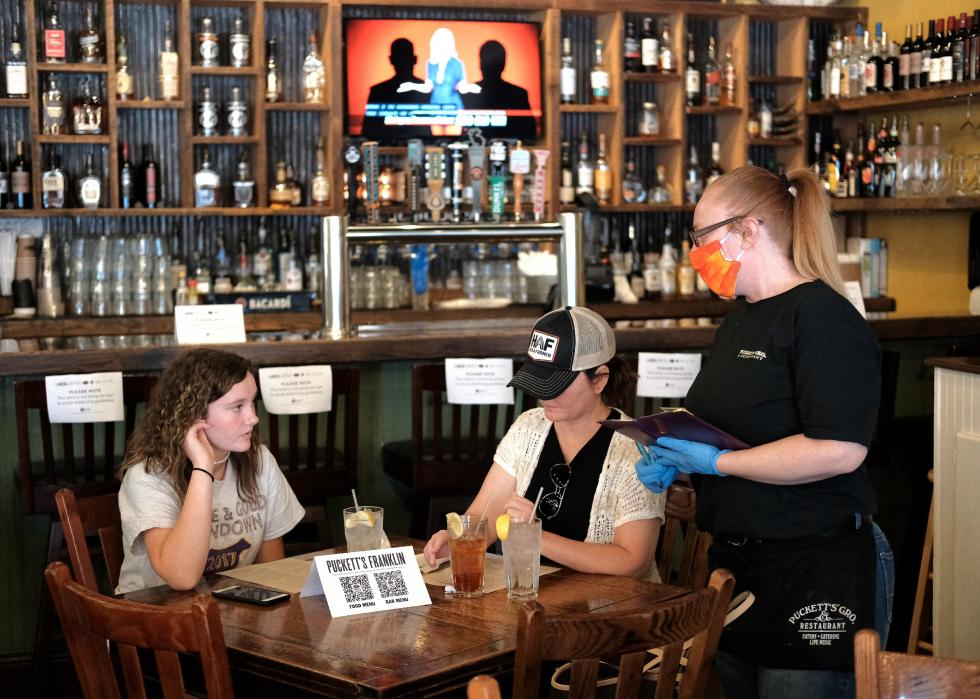
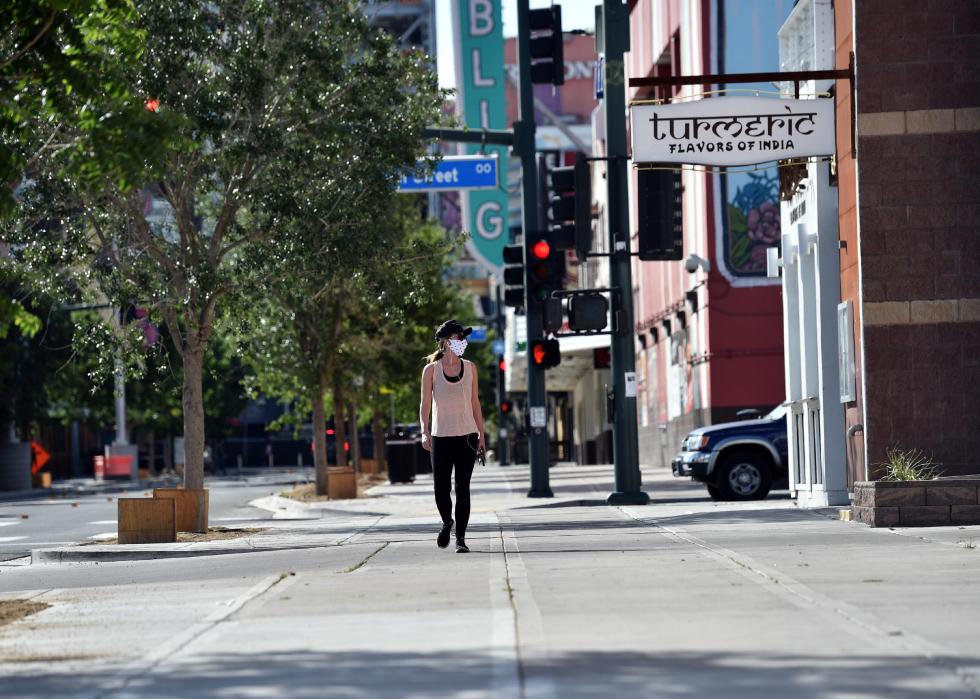
Some communities and people are to the novel coronavirus not only because of underlying health conditions or age, but also because of where they live, where they work, their access to health care, their earnings, and the discrimination they face. These and other influence who gets affected by COVID-19 and how.
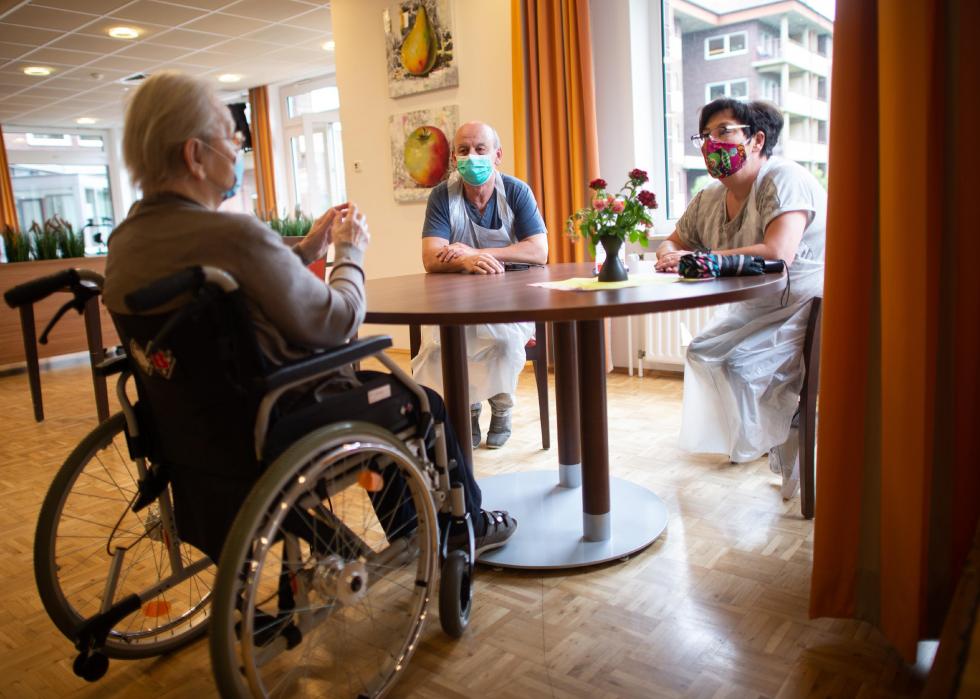
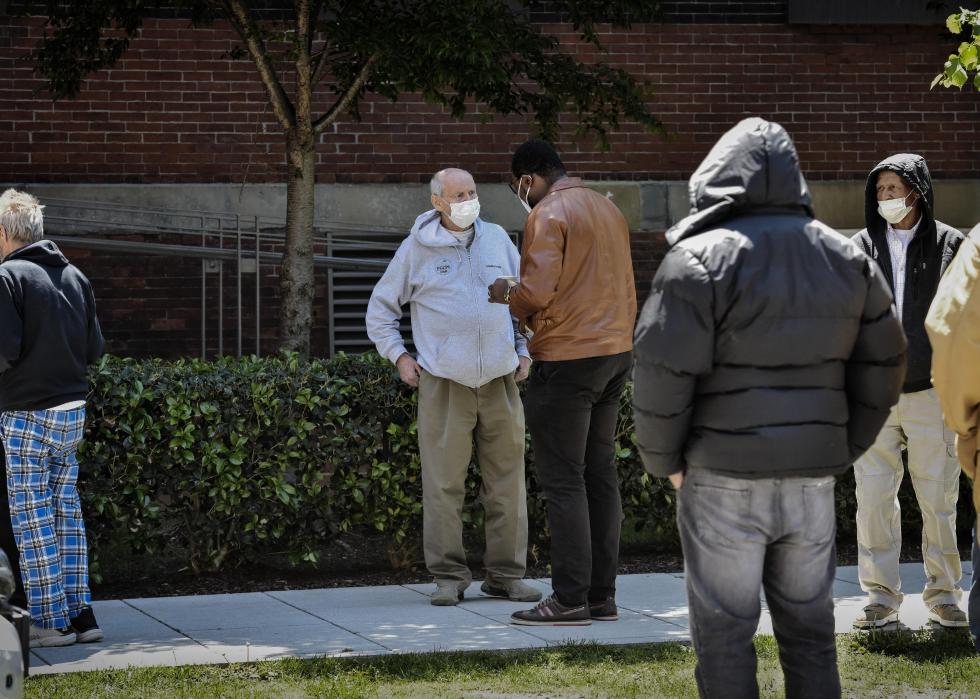
In counties across the country, people of color are dying at higher rates than white people. In several states, people over 65 represent a larger share of COVID-19 cases and deaths relative to their share of the population, as nursing homes across the country have experienced outbreaks.
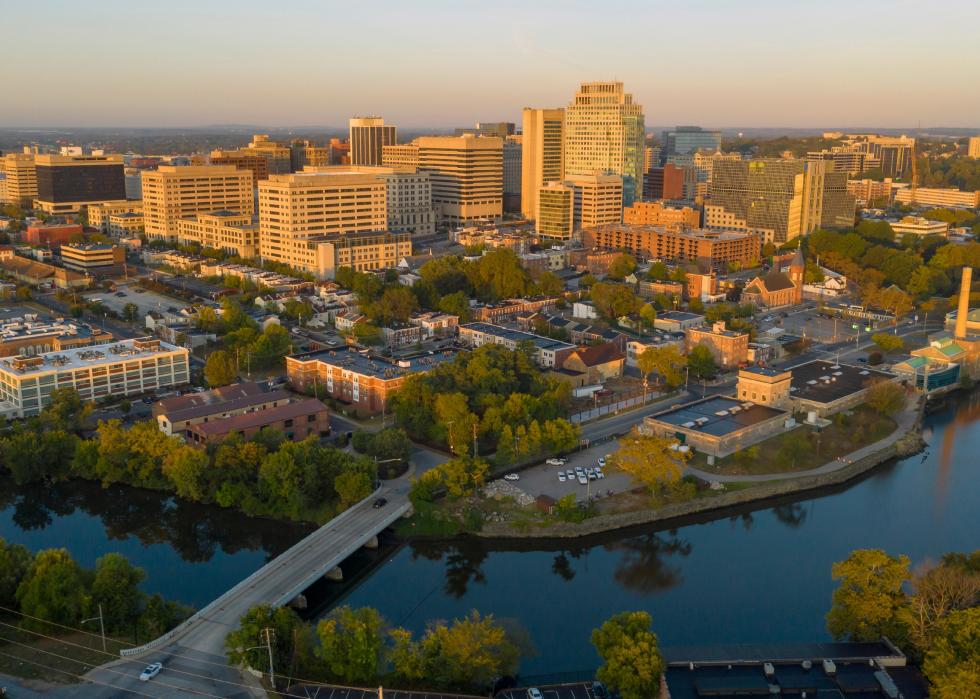
To identify communities more vulnerable to the pandemic, the Surgo Foundation released the in April. The CCVI defines "more vulnerable" communities as those which "have a limited ability to mitigate, treat, and delay transmission of a pandemic disease, and to reduce its economic and social impacts."
The index uses six "themes," or groups of indicators; four themes are adopted from the , which measures a community's resilience from all types of natural disaster from a socio-demographic perspective, and the remaining two themes (epidemiological factors and health care system factors) have been compiled by Surgo Foundation researchers specifically to address COVID-19. The data used to calculate scores comes from 2014鈥2018, depending on the indicator. The index's full methodology (including sources for all indicators) .
In this story, lays out the CCVI scores for each state, as well as each state's two biggest areas of vulnerability (i.e. themes which received the highest scores) and two specific indicators that contributed to each of those areas. Scores range from 0 to 1, and a higher value indicates a more vulnerable population. CCVI scores above 0.6 indicate communities.
Read on to see which states are more vulnerable and why.
You may also like:
#51. New Hampshire
- Overall CCVI score: 0.00
- #1 biggest area of vulnerability: Housing type & transportation (score: 0.38)
--- 60,250 housing structures with 10+ units (9.5%)
--- 27,300 households with no vehicle available (5.2% of all households)
- #2 biggest area of vulnerability: Epidemiological factors (score: 0.36)
--- 30% of adults have high blood pressure
--- 13.2% of adults have asthma
While New Hampshire is far from the most vulnerable to COVID-19, its inherently brings greater risk. Individuals living in crowded housing may find it harder to socially distance. Residents in buildings with 10 or more housing units may also have to touch potentially infected surfaces, like mailboxes and doors, shared with many neighbors.
#50. Vermont
- Overall CCVI score: 0.02
- #1 biggest area of vulnerability: Housing type & transportation (score: 0.76)
--- 19,566 housing structures with 10+ units (5.9%)
--- 17,260 households with no vehicle available (6.6% of all households)
- #2 biggest area of vulnerability: Household composition & disability (score: 0.38)
--- 113,550 over age 65 (18.2% of population)
--- 88,944 disabled over age 5 (14.4% of population)
In Vermont, than more urban counties, and these towns have less primary care doctors鈥攁 barrier for symptomatic people as primary care referrals are needed for testing. These areas are also further from major hospitals, an obstacle to receiving necessary care. In Vermont鈥檚 urban areas, .
#49. Maine
- Overall CCVI score: 0.04
- #1 biggest area of vulnerability (tie): Household composition & disability (score: 0.72)
--- 259,176 over age 65 (19.4% of population)
--- 209,438 disabled over age 5 (15.9% of population)
- #1 biggest area of vulnerability (tie): Housing type & transportation (score: 0.72)
--- 36,020 housing structures with 10+ units (4.9%)
--- 40,732 households with no vehicle available (7.3% of all households)
By the end of April, in the state, according to Maine鈥檚 Division of Disease Surveillance; more than half of the state鈥檚 51 recorded COVID-19 deaths at that time were individuals in nursing homes with outbreaks. Elderly people in nursing homes may be at greater risk of catching the coronavirus given that residents live in close quarters. Once they catch the virus, they鈥檙e at greater risk of more severe disease as older people tend to have .
#48. North Dakota
- Overall CCVI score: 0.06
- #1 biggest area of vulnerability: Housing type & transportation (score: 0.94)
--- 73,282 housing structures with 10+ units (19.9%)
--- 15,942 households with no vehicle available (5.1% of all households)
- #2 biggest area of vulnerability: Healthcare system factors (score: 0.46)
--- 2,003 hospital beds
--- $3,817 healthcare spending per capita
Crowded housing structures might put some North Dakota residents at greater risk of contracting COVID-19, and those who lack a vehicle may be at higher risk of exposure if they rely on public transit. While North Dakota was also ranked vulnerable in terms of its hospital beds, the state has set up eight field hospitals that could support an additional if needed.
#47. Wisconsin
- Overall CCVI score: 0.08
- #1 biggest area of vulnerability: Housing type & transportation (score: 0.44)
--- 284,323 housing structures with 10+ units (10.6%)
--- 158,139 households with no vehicle available (6.7% of all households)
- #2 biggest area of vulnerability: Healthcare system factors (score: 0.36)
--- 11,050 hospital beds
--- $29,722 healthcare spending per capita
Peaks in have historically occurred during recessions, across the U.S. in 2020. In Wisconsin, health officials have warned that the state needs to prepare for that will exceed the state's budget.
You may also like:
#46. Colorado
- Overall CCVI score: 0.10
- #1 biggest area of vulnerability: Minority status & language (score: 0.62)
--- 875,557 non-white (15.8% of population)
--- 60,209 households with limited English (2.8% of all households)
- #2 biggest area of vulnerability: Healthcare system factors (score: 0.52)
--- 8,243 hospital beds
--- $20,581 healthcare spending per capita
In mid-April, the Colorado Department of Public Health and Environment (CDPHE) reported that : Latino people account for 22% of the state鈥檚 population but at the time accounted for about 28% of cases, while Black people make up 4% of the population but represented 7% of cases. Jill Hunsaker-Ryan, executive director of the CDPHE, told Jim Hill and Andrew Kenney of : 鈥淭here have been generations of institutionalized barriers to things like preventive medical care, healthy food, safe and stable housing, quality education, reliable transportation, and clean air. Research shows that these types of factors are the most predictive of health outcomes.鈥
#45. Minnesota
- Overall CCVI score: 0.12
- #1 biggest area of vulnerability: Healthcare system factors (score: 0.68)
--- 10,518 hospital beds
--- $28,265 healthcare spending per capita
- #2 biggest area of vulnerability: Housing type & transportation (score: 0.64)
--- 379,173 housing structures with 10+ units (15.7%)
--- 148,982 households with no vehicle available (6.9% of all households)
Hospitals all over the U.S. have 鈥攊mportant revenue sources鈥攖o reduce spread and make room for COVID-19 patients. To address these cost issues and prepare for a surge of cases, beginning in March, Minnesota health care systems to save costs, including hours of nurses. Other hospitals .
#44. California
- Overall CCVI score: 0.14
- #1 biggest area of vulnerability: Minority status & language (score: 1.00)
--- 15.6 million non-white (39.9% of population)
--- 1.2 million households with limited English (9.1% of all households)
- #2 biggest area of vulnerability: Housing type & transportation (score: 0.86)
--- 2.4 million housing structures with 10+ units (17.2%)
--- 939,034 households with no vehicle available (7.2% of all households)
While California ranks low for its overall CCVI score, it ranks highest out of all the states on the minority status & language vulnerability. Black and Latino Californians are dying more frequently of COVID-19, comprising a compared to white or Asian individuals. This is attributed to higher rates of underlying health conditions鈥攍ike heart disease, obesity, diabetes, and asthma鈥攁s well as overcrowded housing conditions and 鈥.鈥
#43. Wyoming
- Overall CCVI score: 0.16
- #1 biggest area of vulnerability: Housing type & transportation (score: 0.80)
--- 15,939 housing structures with 10+ units (5.8%)
--- 8,873 households with no vehicle available (3.8% of all households)
- #2 biggest area of vulnerability: Household composition & disability (score: 0.58)
--- 87,777 over age 65 (15.1% of population)
--- 74,118 disabled over age 5 (13.0% of population)
Wyoming has low case and death counts relative to other states (the Wyoming Infectious Disease Epidemiology Unit reported about 480 and seven deaths as of May 7), which has prompted the state to allow certain May 1. Teton County, which has one of the highest case counts in Wyoming, is following a different reopening timeline, acting with more caution to prevent further coronavirus spread.
#42. Utah
- Overall CCVI score: 0.18
- #1 biggest area of vulnerability: Healthcare system factors (score: 0.82)
--- 4,630 hospital beds
--- $9,440 healthcare spending per capita
- #2 biggest area of vulnerability: Minority status & language (score: 0.48)
--- 413,294 non-white (13.6% of population)
--- 22,404 households with limited English (2.3% of all households)
A Centers for Medicare and Medicaid Services analysis of state health care data found that states with relatively low health care spending per capita tend to have . While data from the Kaiser Family Foundation shows that Utah's , 9%, is the same as the national average, the is more than double that figure.
You may also like:
#41. South Dakota
- Overall CCVI score: 0.20
- #1 biggest area of vulnerability: Housing type & transportation (score: 0.90)
--- 41,244 housing structures with 10+ units (10.6%)
--- 17,674 households with no vehicle available (5.2% of all households)
- #2 biggest area of vulnerability: Household composition & disability (score: 0.68)
--- 136,808 over age 65 (15.8% of population)
--- 99,939 disabled over age 5 (11.8% of population)
South Dakota has not issued a for all residents but has issued one for in Minnehaha and Lincoln Counties. These people are at risk of more severe disease and death from COVID-19, and the two counties have some of the according to data from the Johns Hopkins University Coronavirus Resource Center.
#40. Virginia
- Overall CCVI score: 0.22
- #1 biggest area of vulnerability: Minority status & language (score: 0.66)
--- 2.7 million non-white (32.0% of population)
--- 83,239 households with limited English (2.7% of all households)
- #2 biggest area of vulnerability: Healthcare system factors (score: 0.42)
--- 17,719 hospital beds
--- $35,011 healthcare spending per capita
In some places, including Virginia, it鈥檚 difficult to determine how the coronavirus is affecting different racial groups. According to data from the Virginia Department of Health, for 32% of confirmed cases at the end of April. This is somewhat of an improvement from earlier data collection efforts, as at the beginning of April.
#39. Rhode Island
- Overall CCVI score: 0.24
- #1 biggest area of vulnerability: Minority status & language (score: 0.54)
--- 202,109 non-white (19.1% of population)
--- 23,316 households with limited English (5.7% of all households)
- #2 biggest area of vulnerability: Socioeconomic status (score: 0.52)
--- 133,055 below poverty level (13.1% of population)
--- $34,619 per capita income
Rhode Island has not been collecting for all people undergoing COVID-19 testing. Reports have shown that over 40% of those who test positive are Latino, but because the state lacks demographic information on about half of those who test positive, health officials are unsure if this is the true proportion. To better communicate health information to the Latino community, the governor and officials from the commerce department are going on Spanish-language radio shows and translating press events into Spanish on Facebook.
#38. Montana
- Overall CCVI score: 0.26
- #1 biggest area of vulnerability: Housing type & transportation (score: 0.88)
--- 28,824 housing structures with 10+ units (5.7%)
--- 21,492 households with no vehicle available (5.1% of all households)
- #2 biggest area of vulnerability: Healthcare system factors (score: 0.72)
--- 2,202 hospital beds
--- $4,615 healthcare spending per capita
Like other states, Montana prepared for a potential surge in cases and bed shortages by canceling elective surgeries. Bozeman Deaconess Hospital began speeding up a construction project to .
#37. Pennsylvania
- Overall CCVI score: 0.28
- #1 biggest area of vulnerability: Epidemiological factors (score: 0.68)
--- 32.6% of adults have high blood pressure
--- 10.1% of adults have asthma
- #2 biggest area of vulnerability: Household composition & disability (score: 0.52)
--- 2.2 million over age 65 (17.4% of population)
--- 1.7 million disabled over age 5 (13.9% of population)
In Pennsylvania, people over 65 accounted for 27% of confirmed COVID-19 cases and nearly 40% of hospitalizations as of May 1, according to the . The state Health Secretary also said that a significant number of those who died had medical conditions, like .
You may also like:
#36. Connecticut
- Overall CCVI score: 0.30
- #1 biggest area of vulnerability: Minority status & language (score: 0.70)
--- 846,624 non-white (23.6% of population)
--- 71,137 households with limited English (5.2% of all households)
- #2 biggest area of vulnerability: Healthcare system factors (score: 0.66)
--- 8,847 hospital beds
--- $22,113 healthcare spending per capita
With just over showing race and ethnicity data at the beginning of April, civil rights and health advocate leaders pressed state officials to better track this data to show how minorities are affected. To address health care system vulnerabilities and free up hospital beds, Connecticut is designating certain nursing facilities as for discharged patients from the hospital who may still be infectious.
#35. Washington
- Overall CCVI score: 0.32
- #1 biggest area of vulnerability: Housing type & transportation (score: 0.84)
--- 479,554 housing structures with 10+ units (15.6%)
--- 192,165 households with no vehicle available (6.9% of all households)
- #2 biggest area of vulnerability: Minority status & language (score: 0.76)
--- 1.7 million non-white (24.0% of population)
--- 106,515 households with limited English (3.8% of all households)
King county, which includes Seattle, set up additional housing structures to allow . People of color, Latinos in particular, have accounted for a disproportionately large share of confirmed COVID-19 cases in Washington, which may be, in part, because Latinos and other immigrant groups tend to live in , meaning that more people can serve as potential , exposing family members.
#34. Florida
- Overall CCVI score: 0.34
- #1 biggest area of vulnerability: Minority status & language (score: 0.88)
--- 5.1 million non-white (24.6% of population)
--- 524,246 households with limited English (6.9% of all households)
- #2 biggest area of vulnerability: Socioeconomic status (score: 0.68)
--- 3.0 million below poverty level (14.8% of population)
--- $30,197 per capita income
In early April showed that testing rates in Florida varied according to counties鈥 median incomes. Even where drive-through test sites are available, . A couple of in minority neighborhoods that do not require people to drive up have somewhat expanded access to these communities.
#33. Nebraska
- Overall CCVI score: 0.36
- #1 biggest area of vulnerability: Epidemiological factors (score: 0.56)
--- 30.6% of adults have high blood pressure
--- 8.2% of adults have asthma
- #2 biggest area of vulnerability: Household composition & disability (score: 0.48)
--- 286,080 over age 65 (15% of population)
--- 215,423 disabled over age 5 (11.5% of population)
Several outbreaks have occurred at Nebraska and . Across the U.S. thousands of deaths from COVID-19 have been connected to .
#32. Massachusetts
- Overall CCVI score: 0.38
- #1 biggest area of vulnerability: Epidemiological factors (score: 0.72)
--- 28.6% of adults have high blood pressure
--- 11.5% of adults have asthma
- #2 biggest area of vulnerability: Minority status & language (score: 0.64)
--- 1.5 million non-white (21.5% of population)
--- 152,975 households with limited English (5.9% of all households)
Historically, Massachusetts has reported among its residents, with rates highest among Black adults and children and Hispanic children. , had the in the state at the end of April; Chelsea also has according to the Massachusetts Department of Public Health, which potentially puts residents at greater risk of COVID-19 complications. Air pollution also affects Chelsea residents, and scientists are investigating the role of long-term exposure to pollutants as a possible risk factor for COVID-19 death.
You may also like:
#31. Ohio
- Overall CCVI score: 0.40
- #1 biggest area of vulnerability: Epidemiological factors (score: 0.86)
--- 34.7% of adults have high blood pressure
--- 9.9% of adults have asthma
- #2 biggest area of vulnerability: Household composition & disability (score: 0.74)
--- 1.9 million over age 65 (16.3% of population)
--- 1.6 million disabled over age 5 (13.9% of population)
People over the age of 60 comprised over 90% of as of May 6, according to the Ohio Department of Health. Preliminary data from the state shows that every county in the state, except Fairfield and Scioto, have among residents. are extremely vulnerable to more severe illness.
#30. Maryland
- Overall CCVI score: 0.42
- #1 biggest area of vulnerability: Minority status & language (score: 0.80)
--- 2.6 million non-white (43.8% of population)
--- 69,718 households with limited English (3.2% of all households)
- #2 biggest area of vulnerability: Epidemiological factors (score: 0.70)
--- 32.4% of adults have high blood pressure
--- 9.4% of adults have asthma
In Prince George County, bordering Washington D.C. on the Maryland side, at the beginning of May, with an additional 2,800 cases lacking race and ethnicity data. Despite being one of the wealthiest majority-Black counties in the U.S., Black residents are still more likely to be affected by underlying health conditions like hypertension and asthma, and have compared to people in neighboring, whiter counties.
#29. Idaho
- Overall CCVI score: 0.44
- #1 biggest area of vulnerability: Healthcare system factors (score: 0.80)
--- 2,470 hospital beds
--- $6,043 healthcare spending per capita
- #2 biggest area of vulnerability: Household composition & disability (score: 0.78)
--- 253,801 over age 65 (15% of population)
--- 221,349 disabled over age 5 (13.3% of population)
Data from the Harvard Global Health Institute shows that if 40% of adults in the Boise region contract COVID-19 over the course of 12 months, about 8% would need to be hospitalized, demanding . Throughout April, several Idaho . While nursing homes implemented infection control measures and disallowed visitors, the shortage of personal protective equipment, staffing, and tests likely contributed.
#28. New Jersey
- Overall CCVI score: 0.46
- #1 biggest area of vulnerability: Minority status & language (score: 0.90)
--- 2.9 million non-white (32.1% of population)
--- 226,180 households with limited English (7.0% of all households)
- #2 biggest area of vulnerability: Healthcare system factors (score: 0.62)
--- 20,207 hospital beds
--- $48,841 healthcare spending per capita
It is not uncommon for either because they cannot access interpreters in hospitals or because interpreters make clinically significant errors, a relevant issue for New Jersey鈥檚 large . Additionally, preliminary figures from the New Jersey Department of Health show that , comprising 28.9% of confirmed COVID-19 cases for which race or ethnicity was reported, as of May 2. This group only accounts for .
#27. Texas
- Overall CCVI score: 0.48
- #1 biggest area of vulnerability: Minority status & language (score: 0.96)
--- 7.2 million non-white (25.7% of population)
--- 753,508 households with limited English (7.9% of all households)
- #2 biggest area of vulnerability: Socioeconomic status (score: 0.72)
--- 4.2 million below poverty level (15.5% of population)
--- $30,143 per capita income
Texas used to have a state office that aimed to solve racial inequities in state health agencies鈥攖he Center for Elimination of Disproportionality and Disparities鈥攂ut it . COVID-19's outsized effects on the Back community in Texas, a product of long-standing structural health disparities and racism, have convinced some Texas lawmakers that this office needs to be revived.
#26. Iowa
- Overall CCVI score: 0.50
- #1 biggest area of vulnerability: Healthcare system factors (score: 0.74)
--- 6,266 hospital beds
--- $15,378 healthcare spending per capita
- #2 biggest area of vulnerability: Household composition & disability (score: 0.60)
--- 513,312 over age 65 (16.4% of population)
--- 356,949 disabled over age 5 (11.6% of population)
The Harvard Global Health Institute predicts that over the course of a year, if 40% of adults contract COVID-19 an estimated 8% would require hospital care and the Des Moines area would . As of May 6, the state鈥檚 hospitals have not been overwhelmed, and almost half of .
#25. Illinois
- Overall CCVI score: 0.52
- #1 biggest area of vulnerability: Epidemiological factors (score: 0.80)
--- 32.3% of adults have high blood pressure
--- 8.2% of adults have asthma
- #2 biggest area of vulnerability: Minority status & language (score: 0.74)
--- 3.6 million non-white (28.3% of population)
--- 218,048 households with limited English (4.5% of all households)
In Chicago, of confirmed COVID-19 cases showed that than other groups. Throughout the state, Black people accounted for 19.9% of confirmed cases and 34.5% of deaths as of May 3, while they make up just 14.6% of the population. They experience at higher rates, and have not been able to access testing as easily as those in .
#24. Arizona
- Overall CCVI score: 0.54
- #1 biggest area of vulnerability: Minority status & language (score: 0.84)
--- 1.6 million non-white (22.8% of population)
--- 107,223 households with limited English (4.2% of all households)
- #2 biggest area of vulnerability: Socioeconomic status (score: 0.70)
--- 1.1 million below poverty level (16.1% of population)
--- $29,265 per capita income
As of May 1, there were over , mostly in Arizona, areas which have the in the state. The vulnerability of Native Americans is greater than other groups as between and are common.
#23. Michigan
- Overall CCVI score: 0.56
- #1 biggest area of vulnerability (tie): Household composition & disability (score: 0.64)
--- 1.6 million over age 65 (16.3% of population)
--- 1.4 million disabled over age 5 (14.2% of population)
- #1 biggest area of vulnerability (tie): Epidemiological factors (score: 0.64)
--- 34.7% of adults have high blood pressure
--- 10.8% of adults have asthma
As of May 4, those over 60 represented about according to data from the Michigan Department of Health and Human Services. Hundreds of cases have been linked to across the state.
#22. Delaware
- Overall CCVI score: 0.58
- #1 biggest area of vulnerability: Epidemiological factors (score: 0.82)
--- 34.9% of adults have high blood pressure
--- 10.6% of adults have asthma
- #2 biggest area of vulnerability: Minority status & language (score: 0.72)
--- 294,590 non-white (31.0% of population)
--- 8,239 households with limited English (2.3% of all households)
As in other states, account for most COVID-19 deaths in Delaware. A large proportion of adults in Delaware have high blood pressure and asthma, potentially making them more vulnerable to the disease.
You may also like:
#21. Alaska
- Overall CCVI score: 0.60
- #1 biggest area of vulnerability: Housing type & transportation (score: 0.98)
--- 23,544 housing structures with 10+ units (7.5%)
--- 23,959 households with no vehicle available (9.5% of all households)
- #2 biggest area of vulnerability: Minority status & language (score: 0.60)
--- 259,682 non-white (35.2% of population)
--- 5,294 households with limited English (2.1% of all households)
Several villages with largely Alaskan native populations were quick to respond to COVID-19 threats, with some implementing . Alaskan native individuals face vulnerability to infectious disease due to crowded housing and lack of adequate sanitation services in rural areas.
#20. New York
- Overall CCVI score: 0.62
- #1 biggest area of vulnerability: Housing type & transportation (score: 0.92)
--- 2.3 million housing structures with 10+ units (28.0%)
--- 2.1 million households with no vehicle available (29.1% of all households)
- #2 biggest area of vulnerability: Minority status & language (score: 0.82)
--- 7.1 million non-white (36.2% of population)
--- 593,391 households with limited English (8.1% of all households)
By the end of April, , hospitalization rates, and COVID-19 deaths were highest in the poorest New York City borough, the Bronx, which also has a . About 20% of residents also live in (more than one person per room) in some areas of the Bronx, potentially contributing to the quick spread of the virus.
#19. Washington DC
- Overall CCVI score: 0.64
- #1 biggest area of vulnerability: Housing type & transportation (score: 1.00)
--- 144,039 housing structures with 10+ units (46.2%)
--- 99,637 households with no vehicle available (35.4% of all households)
- #2 biggest area of vulnerability: Minority status & language (score: 0.86)
--- 404,029 non-white (59.0% of population)
--- 9,951 households with limited English (3.5% of all households)
With few households possessing a car, many rely on public transit, which puts D.C. residents at increased risk of spreading and contracting COVID-19. In D.C. the demographics of those affected by COVID-19 reflect the trends of the rest of the country. Black people account for , and the Washington Post reports that Latino residents of D.C. are experiencing .
#18. Oregon
- Overall CCVI score: 0.66
- #1 biggest area of vulnerability: Housing type & transportation (score: 0.96)
--- 212,343 housing structures with 10+ units (12.1%)
--- 119,031 households with no vehicle available (7.5% of all households)
- #2 biggest area of vulnerability: Socioeconomic status (score: 0.64)
--- 565,247 below poverty level (14.1% of population)
--- $32,045 per capita income
Marion County, which contains the capital city, Salem, has the in the state. Many of these cases are concentrated among Woodburn residents who tend to have lower income. Woodburn also has a high proportion of farmworkers who perform essential agriculture jobs, who cannot practice social distancing on the job, and who cannot afford to miss work.
#17. Georgia
- Overall CCVI score: 0.68
- #1 biggest area of vulnerability: Socioeconomic status (score: 0.84)
--- 1.6 million below poverty level (16% of population)
--- $29,523 per capita income
- #2 biggest area of vulnerability: Minority status & language (score: 0.78)
--- 4.2 million non-white (41.0% of population)
--- 106,906 households with limited English (2.9% of all households)
The , where around and most are Black. Nine counties in southwest Georgia have case rates comparable to those in some . The high rates of poverty and poor health care access in this region make people in southwest Georgia鈥攅specially the Black辫辞辫耻濒补迟颈辞苍鈥, more likely to have underlying health conditions, and more likely to hold essential jobs.
#16. Indiana
- Overall CCVI score: 0.70
- #1 biggest area of vulnerability: Household composition & disability (score: 0.76)
--- 996,063 over age 65 (15% of population)
--- 897,062 disabled over age 5 (13.7% of population)
- #2 biggest area of vulnerability: Epidemiological factors (score: 0.74)
--- 35.2% of adults have high blood pressure
--- 10% of adults have asthma
Indiana officials announced May 4 that people connected to nursing homes or other long-term care facilities accounted for in the state. People over 70 represent about three-quarters of Indiana coronavirus deaths, likely due to the health issues like high blood pressure that commonly affect older populations, .
#15. Kansas
- Overall CCVI score: 0.72
- #1 biggest area of vulnerability: Healthcare system factors (score: 0.78)
--- 6,466 hospital beds
--- $13,975 healthcare spending per capita
- #2 biggest area of vulnerability: Household composition & disability (score: 0.70)
--- 437,777 over age 65 (15.1% of population)
--- 366,994 disabled over age 5 (12.9% of population)
Kansas鈥 greatest area of vulnerability is its health care system. If data from the Harvard Global Health Institute proves correct, Kansas鈥 metro areas could require as many as in a moderate scenario. In this scenario, 40% of the adult population would contract COVID-19, and 8% would need to be hospitalized.
#14. Missouri
- Overall CCVI score: 0.74
- #1 biggest area of vulnerability: Household composition & disability (score: 0.80)
--- 981,692 over age 65 (16.1% of population)
--- 868,403 disabled over age 5 (14.5% of population)
- #2 biggest area of vulnerability: Epidemiological factors (score: 0.78)
--- 32% of adults have high blood pressure
--- 9.4% of adults have asthma
Six since 2010, which could contribute to the COVID-19 vulnerability of older people living in rural regions. About , according to 2011 data from the Missouri Department of Health & Senior Services, the most recent data provided by the state.
#13. Tennessee
- Overall CCVI score: 0.76
- #1 biggest area of vulnerability: Epidemiological factors (score: 0.94)
--- 38.7% of adults have high blood pressure
--- 10% of adults have asthma
- #2 biggest area of vulnerability: Socioeconomic status (score: 0.82)
--- 1.0 million below poverty level (16.1% of population)
--- $28,511 per capita income
This pandemic puts , especially for people who work essential jobs, as they often cannot social distance or afford to stay home from work. People with low incomes also cannot regularly afford healthy food or preventive healthcare. In , has the highest rate of people who cannot regularly afford nutritious food, which leads many to turn to diets high in sodium and sugar, leading to high blood pressure.
#12. Hawaii
- Overall CCVI score: 0.78
- #1 biggest area of vulnerability: Minority status & language (score: 0.98)
--- 1.1 million non-white (75.0% of population)
--- 27,640 households with limited English (6.1% of all households)
- #2 biggest area of vulnerability: Housing type & transportation (score: 0.78)
--- 132,177 housing structures with 10+ units (24.5%)
--- 37,579 households with no vehicle available (8.2% of all households)
Native Hawaiians and Pacific Islanders have higher rates of relative to their share of the population both in Hawaii and in other states like . Part of this overrepresentation may be because they often work in essential jobs, have large families, and live in multigenerational households, among other factors鈥攍ike social inequities鈥攖hat could put them at greater risk for exposure.
You may also like:
#11. Kentucky
- Overall CCVI score: 0.80
- #1 biggest area of vulnerability (tie): Household composition & disability (score: 0.90)
--- 691,509 over age 65 (15.6% of population)
--- 755,386 disabled over age 5 (17.3% of population)
- #1 biggest area of vulnerability (tie): Epidemiological factors (score: 0.90)
--- 39.4% of adults have high blood pressure
--- 10.7% of adults have asthma
Older people in Kentucky nursing homes are particularly vulnerable to COVID-19 as many facilities before the pandemic. As of May 4, of Kentucky鈥檚 5,934 .
#10. South Carolina
- Overall CCVI score: 0.82
- #1 biggest area of vulnerability: Socioeconomic status (score: 0.86)
--- 770,632 below poverty level (16% of population)
--- $27,986 per capita income
- #2 biggest area of vulnerability: Household composition & disability (score: 0.84)
--- 829,083 over age 65 (16.7% of population)
--- 710,864 disabled over age 5 (14.6% of population)
The effects of COVID-19 have prompted some South Carolina officials to call on the state to expand Medicaid, which would allow to obtain health care coverage. Without access to quality health care, these people are more likely to develop conditions like high blood pressure and respiratory issues, of COVID-19.
#9. North Carolina
- Overall CCVI score: 0.84
- #1 biggest area of vulnerability: Healthcare system factors (score: 0.98)
--- 23,194 hospital beds
--- $41,838 healthcare spending per capita
- #2 biggest area of vulnerability: Socioeconomic status (score: 0.80)
--- 1.5 million below poverty level (15.4% of population)
--- $29,456 per capita income
As of early May, the North Carolina Department of Health and Human Services reported that were still available for patients statewide. But in the moderate scenario predicted by the Harvard Global Health Institute, in which 40% of the adult population is infected and 8% require hospitalization, North Carolina in that period, depending on the area in question.
#8. Nevada
- Overall CCVI score: 0.86
- #1 biggest area of vulnerability: Epidemiological factors (score: 1.00)
--- 32.7% of adults have high blood pressure
--- 10.4% of adults have asthma
- #2 biggest area of vulnerability: Minority status & language (score: 0.92)
--- 987,746 non-white (33.8% of population)
--- 66,263 households with limited English (6.2% of all households)
Clark County, which is home to over of the state鈥檚 roughly , reported out of 4,408 confirmed cases on May 4. Hypertension was the most common underlying health condition reported. , which is likely due to socioeconomic factors, poor health care access, and legacies of racist policies in the county and nationwide, according to the Southern Nevada Health District鈥檚 Office of Chronic Disease Prevention and Health Promotion manager, Maria Azzarelli.
#7. New Mexico
- Overall CCVI score: 0.88
- #1 biggest area of vulnerability: Socioeconomic status (score: 0.98)
--- 410,389 below poverty level (20% of population)
--- $26,085 per capita income
- #2 biggest area of vulnerability: Minority status & language (score: 0.94)
--- 533,548 non-white (25.5% of population)
--- 41,207 households with limited English (5.3% of all households)
In Native American communities in northwestern New Mexico, , people live in crowded housing, food and medical care can be difficult to access, and people tend to have . Northwestern New Mexico has also reported higher rates of coronavirus infections. The socioeconomic disparities experienced by these communities can make it more difficult to maintain a healthy lifestyle and .
#6. West Virginia
- Overall CCVI score: 0.90
- #1 biggest area of vulnerability (tie): Socioeconomic status (score: 0.96)
--- 315,464 below poverty level (17.8% of population)
--- $25,479 per capita income
- #1 biggest area of vulnerability (tie): Household composition & disability (score: 0.96)
--- 344,719 over age 65 (18.8% of population)
--- 351,034 disabled over age 5 (19.5% of population)
- #1 biggest area of vulnerability (tie): Epidemiological factors (score: 0.96)
--- 43.5% of adults have high blood pressure
--- 12.7% of adults have asthma
West Virginia鈥檚 elderly population has been affected by nursing home outbreaks, and the governor issued an to test all nursing home residents and staff in the state. As of May 5, about had tested positive, according to preliminary data from the West Virginia Department of Health and Human Resources.
#5. Alabama
- Overall CCVI score: 0.92
- #1 biggest area of vulnerability (tie): Socioeconomic status (score: 0.92)
--- 829,400 below poverty level (17.5% of population)
--- $26,846 per capita income
- #1 biggest area of vulnerability (tie): Healthcare system factors (score: 0.92)
--- 15,542 hospital beds
--- $21,977 healthcare spending per capita
Alabama did not , and, like in other states that followed suit, some officials are pushing to expand coverage for low-income residents in light of COVID-19. According to data from the Census Bureau, about .
#4. Oklahoma
- Overall CCVI score: 0.94
- #1 biggest area of vulnerability: Healthcare system factors (score: 0.96)
--- 10,312 hospital beds
--- $17,108 healthcare spending per capita
- #2 biggest area of vulnerability: Household composition & disability (score: 0.94)
--- 589,230 over age 65 (15% of population)
--- 610,546 disabled over age 5 (15.9% of population)
As part of its to address potential health care system vulnerabilities, state officials struck a deal with Oklahoma City and Tulsa hospitals to reserve beds in case of a sudden influx of COVID-19 hospitalizations. As of May 6, people over 65 accounted for nearly 30% of , according to the State Department of Health. The state鈥檚 population of people with disabilities may be as well, not necessarily in terms of case counts, but in terms of limitations to their care and access to services.
#3. Arkansas
- Overall CCVI score: 0.96
- #1 biggest area of vulnerability: Household composition & disability (score: 0.98)
--- 487,536 over age 65 (16.3% of population)
--- 503,918 disabled over age 5 (17.2% of population)
- #2 biggest area of vulnerability: Healthcare system factors (score: 0.94)
--- 7,848 hospital beds
--- $12,824 healthcare spending per capita
In addition to having a high overall CCVI score, Arkansas has a high score, according to the CDC, and 45.4% of Arkansas residents live in areas considered to be more vulnerable than other areas. Arkansas鈥 high proportion of older people and health care system factors are the main contributors, but relatively high poverty rates also contribute to the state鈥檚 vulnerability. As of May 2, people over 65 accounted for 16.9% of the state鈥檚 confirmed cases but almost 69.9% of reported deaths, according to the .
#2. Louisiana
- Overall CCVI score: 0.98
- #1 biggest area of vulnerability: Epidemiological factors (score: 0.98)
--- 39% of adults have high blood pressure
--- 9% of adults have asthma
- #2 biggest area of vulnerability: Socioeconomic status (score: 0.94)
--- 878,394 below poverty level (19.4% of population)
--- $27,027 per capita income
While Black people represent about , they have accounted for as of May 4, according to data from the state Department of Health. Additionally, over half of those who died from COVID-19 in Louisiana also had high blood pressure. Among Black people, .
#1. Mississippi
- Overall CCVI score: 1.00
- #1 biggest area of vulnerability (tie): Socioeconomic status (score: 1.00)
--- 599,795 below poverty level (20.8% of population)
--- $23,434 per capita income
- #1 biggest area of vulnerability (tie): Household composition & disability (score: 1.00)
--- 449,478 over age 65 (15% of population)
--- 475,522 disabled over age 5 (16.3% of population)
Mississippi residents are especially vulnerable to the effects of COVID-19. One in every five residents lives below the poverty level, and low-income people are more likely to work in jobs like public transportation or grocery stores that could . People with low incomes also often lack health insurance and have higher rates of chronic diseases.