Cities with the most expensive homes in the Omaha metro area

Written by:
February 24, 2026
4 PM production // Shutterstock

Cities with the most expensive homes in the Omaha metro area

Purchasing a home is one of the most important investments there is. More than a place to live, homeownership is an asset with the potential to tremendously rise in value. But with home prices reaching record heights, plays a huge role for buyers.

The typical home value in the United States was $361,371 in February, 0.4% higher than the year before.

High mortgage rates are also making monthly payments more expensive; as of March 19, the sits at 6.22%.

Although home prices have inflated all across the U.S., there are some cities that command a higher price tag than others. Location, size, age, and condition are all contributing factors to home value.

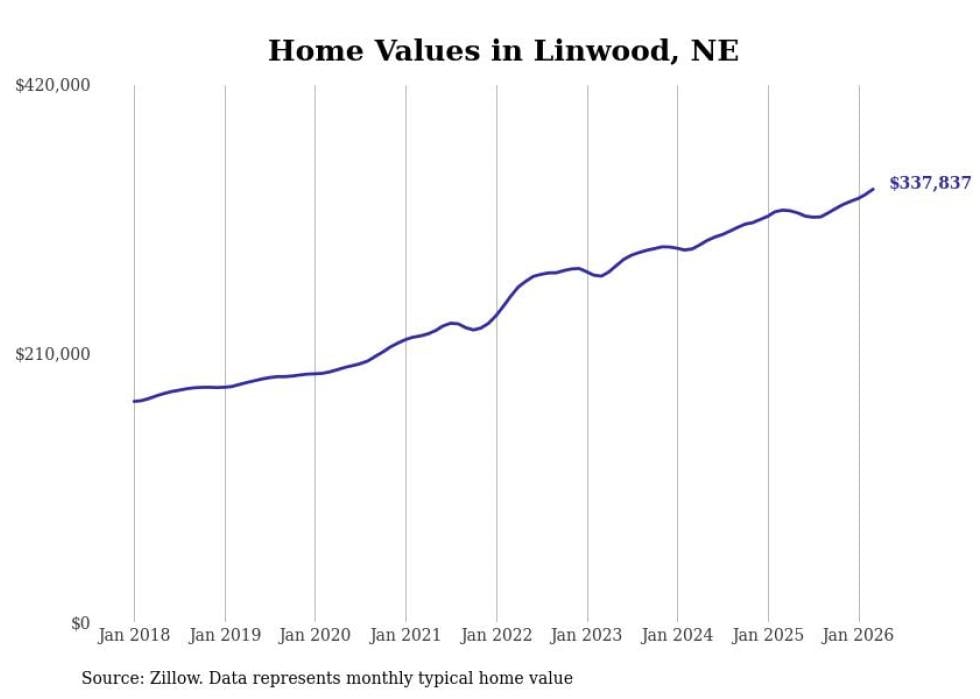
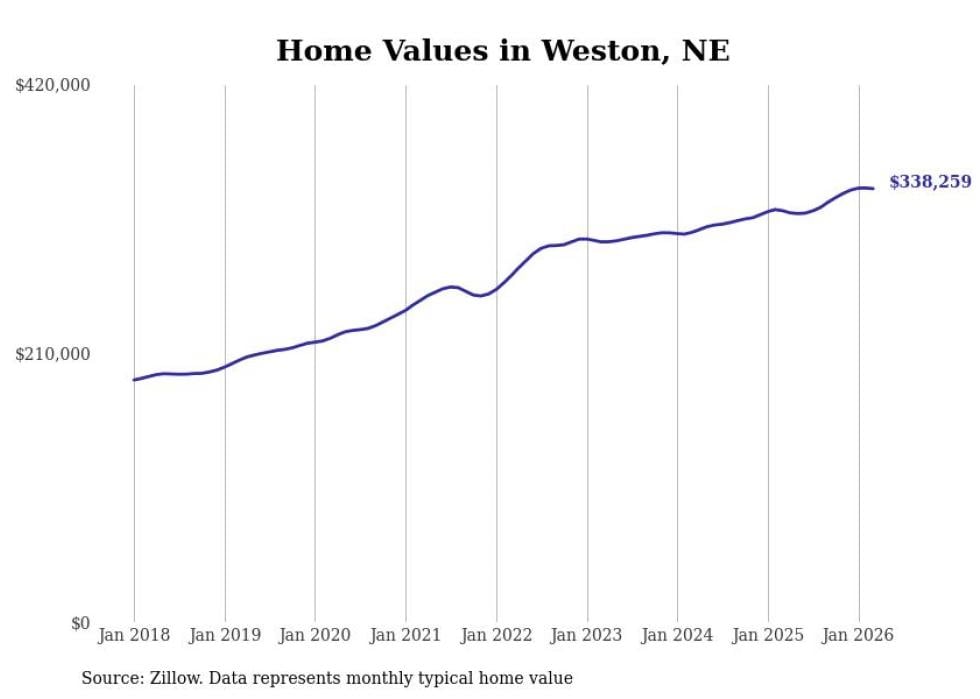
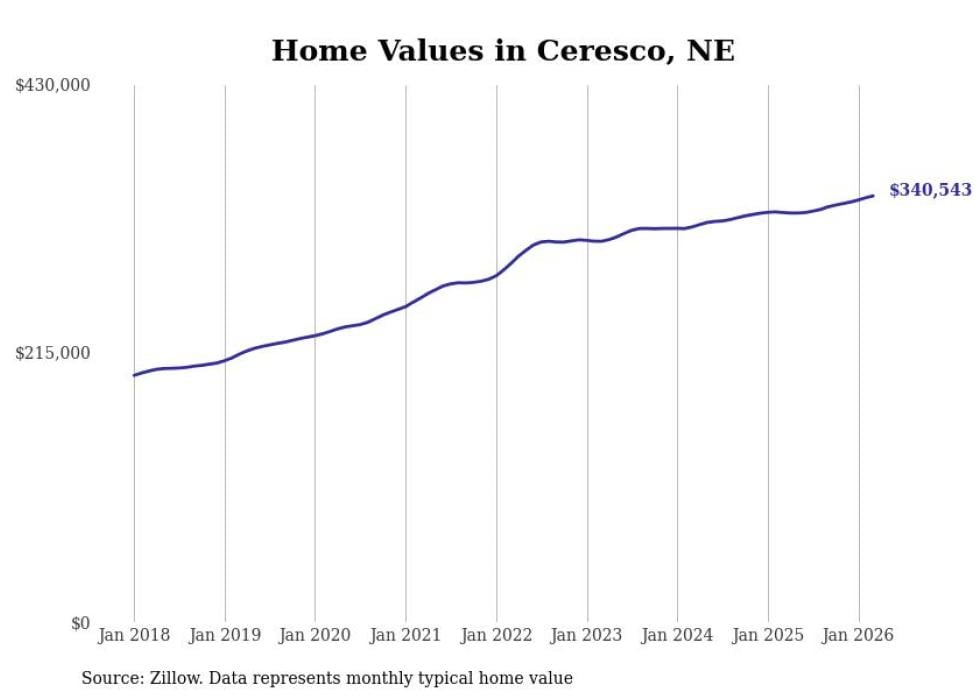
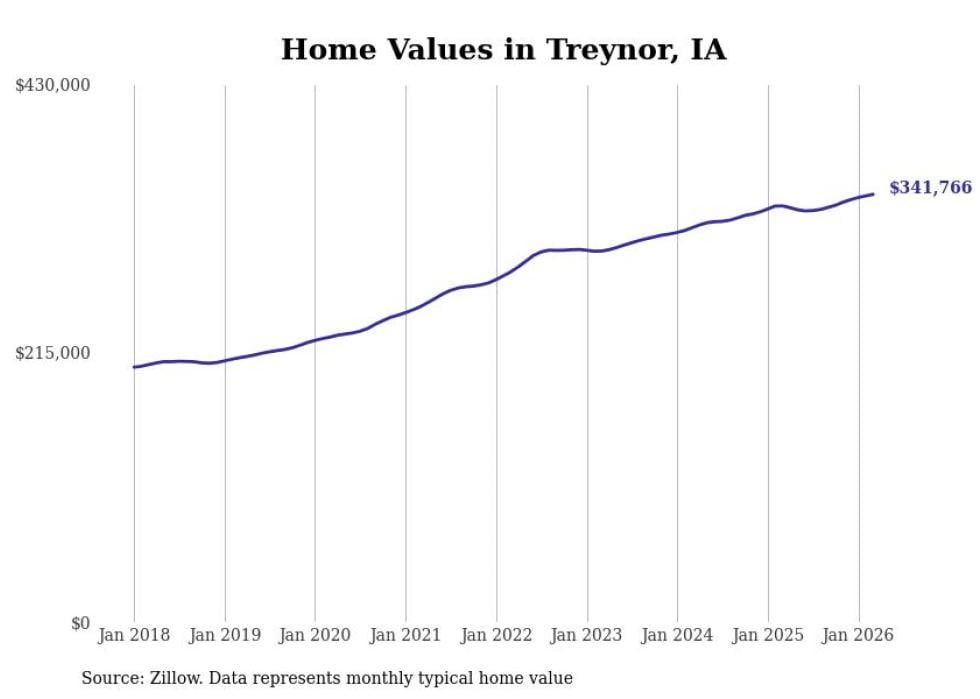
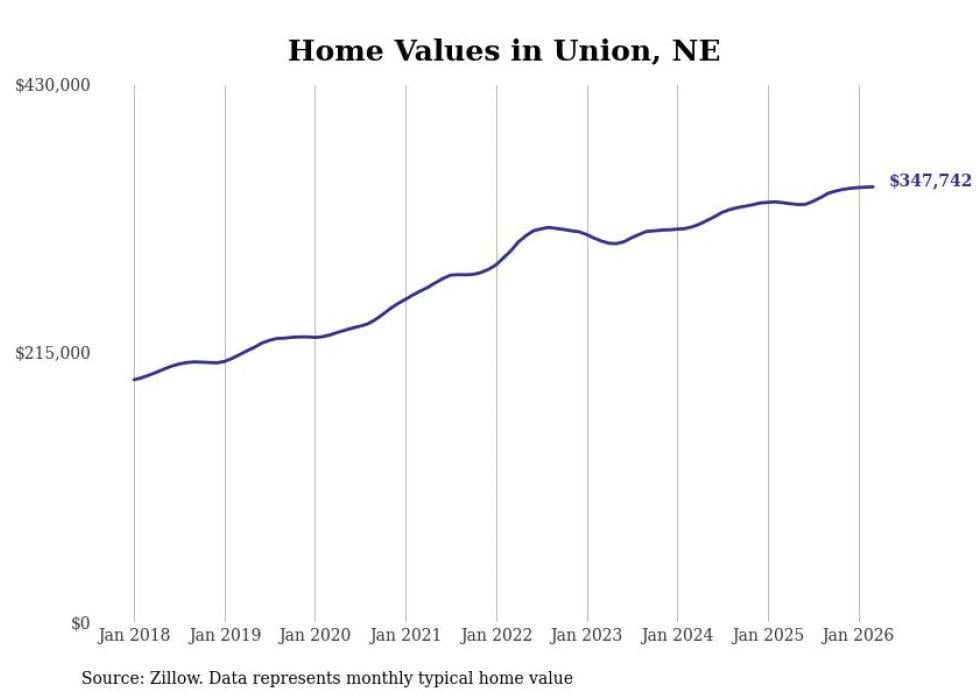
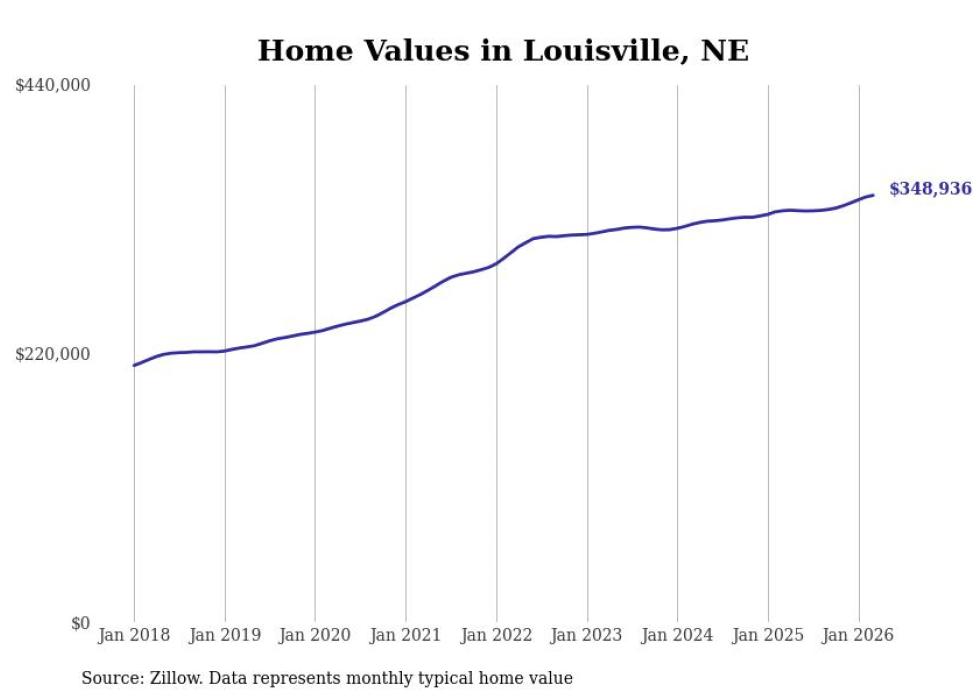
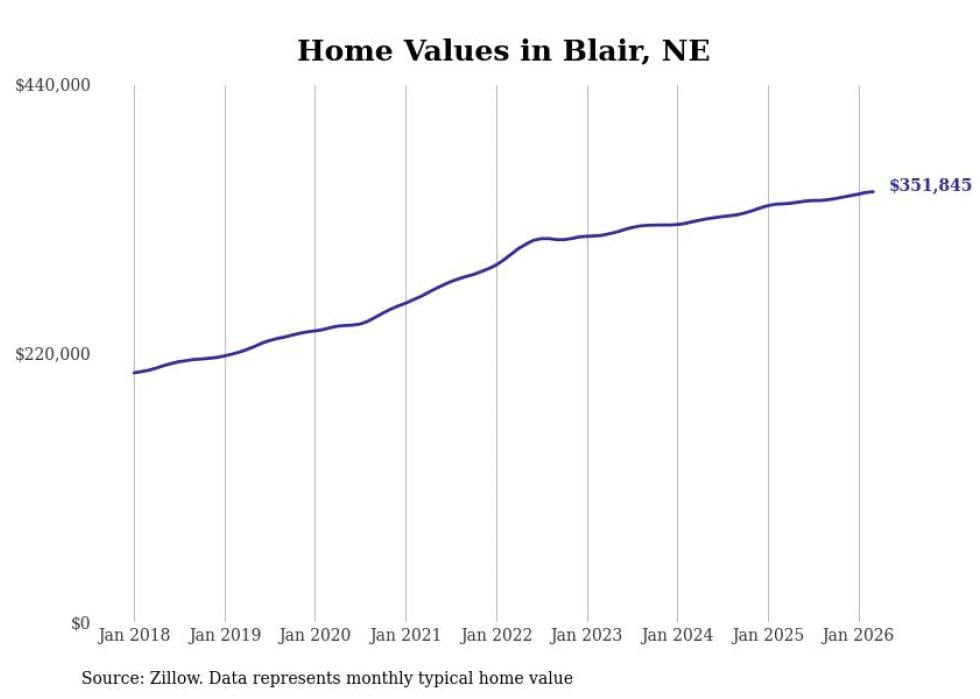
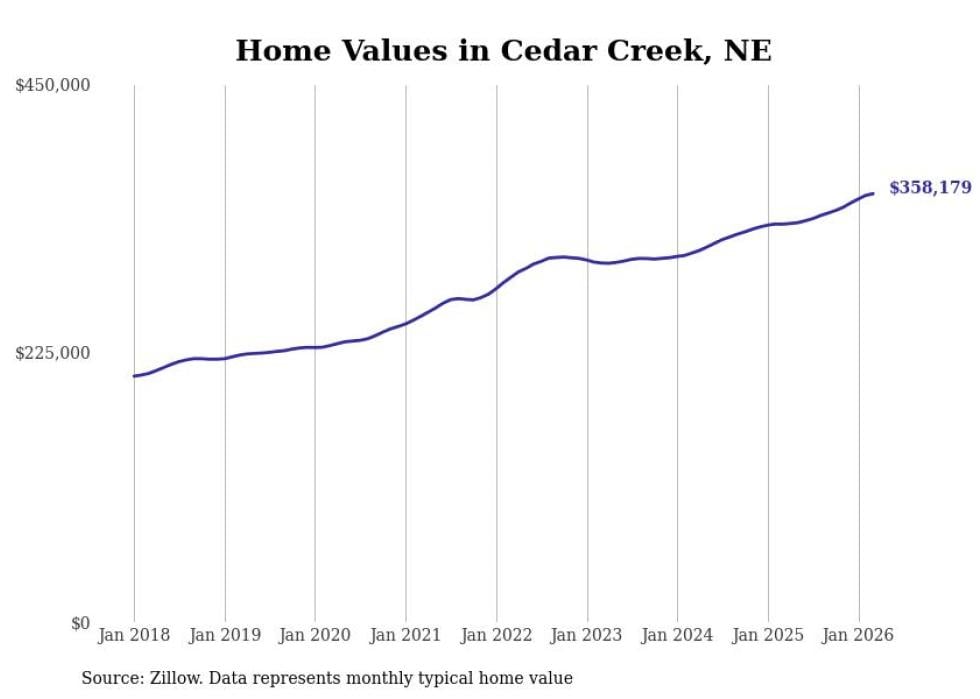
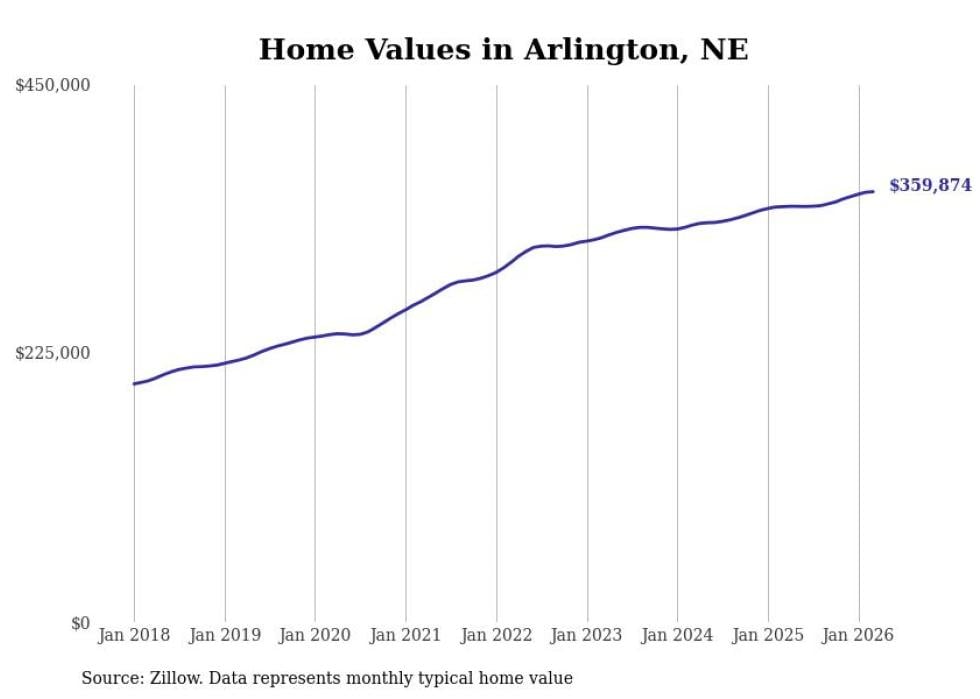
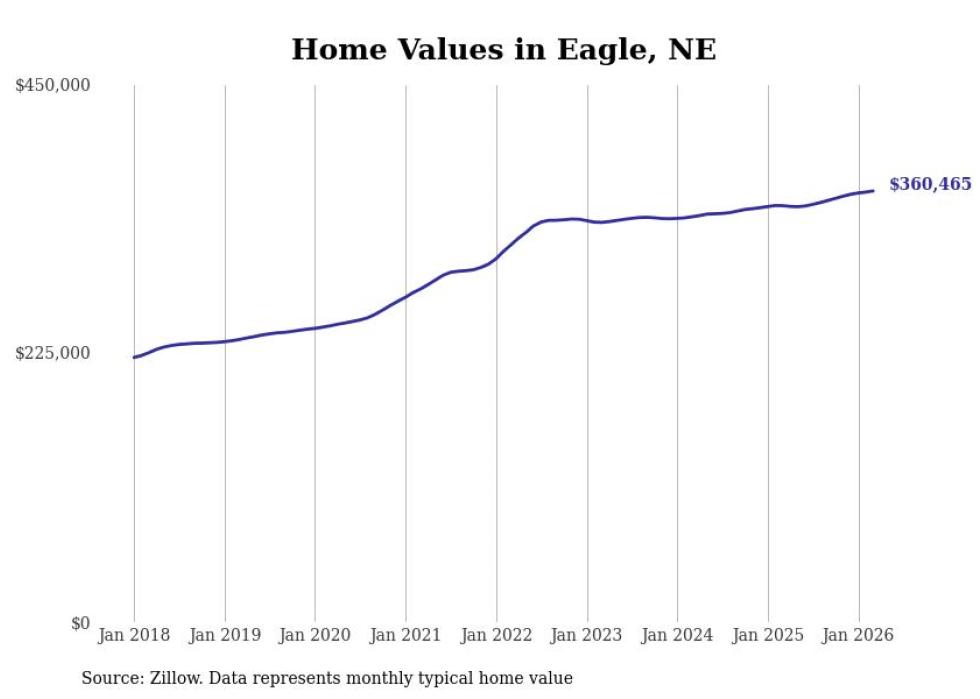
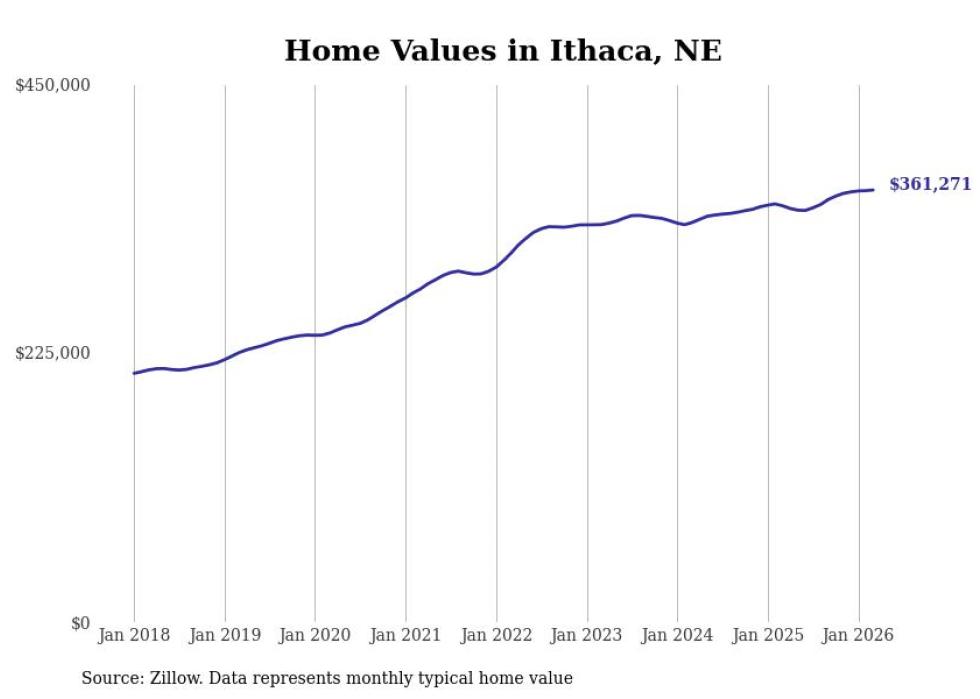
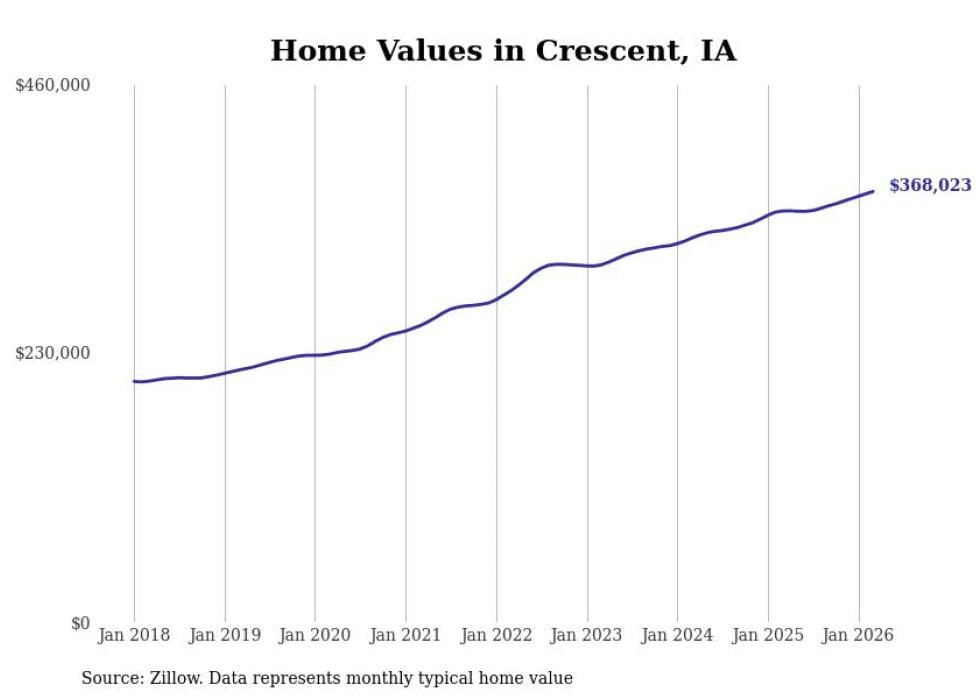
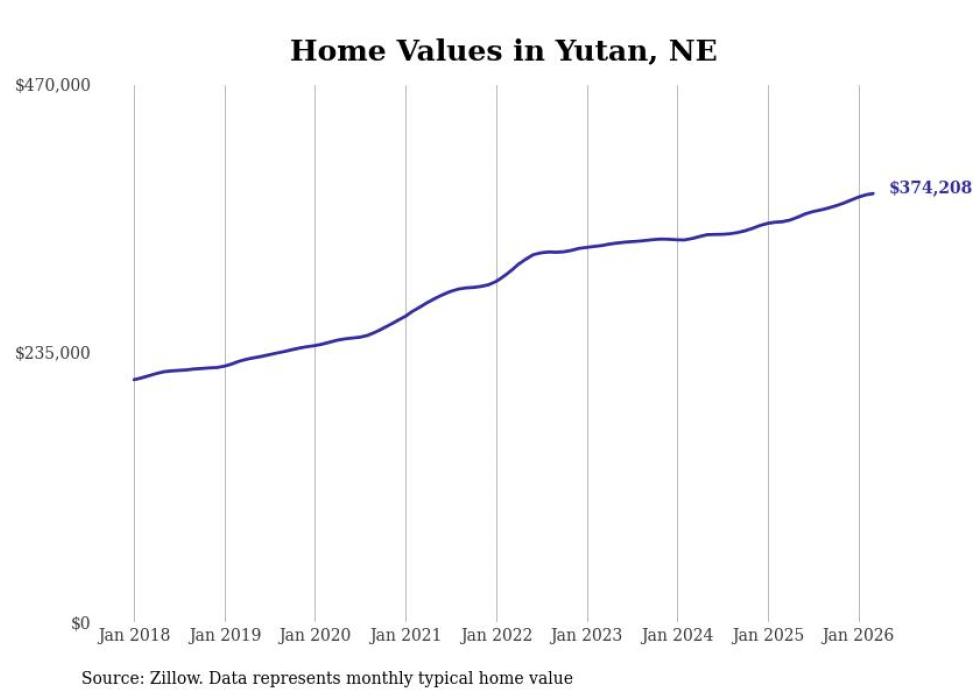
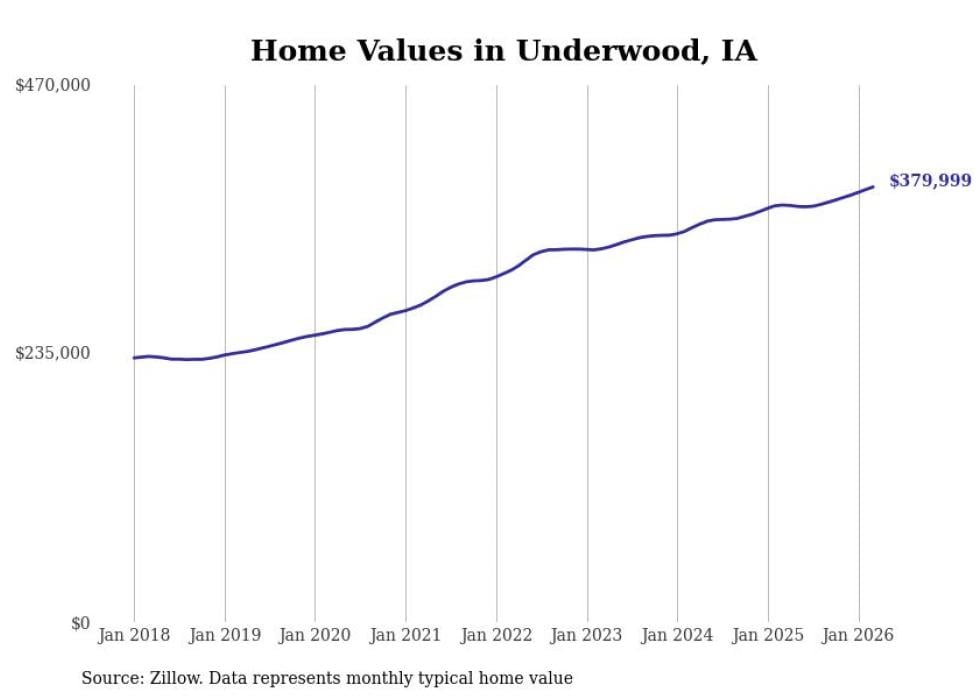
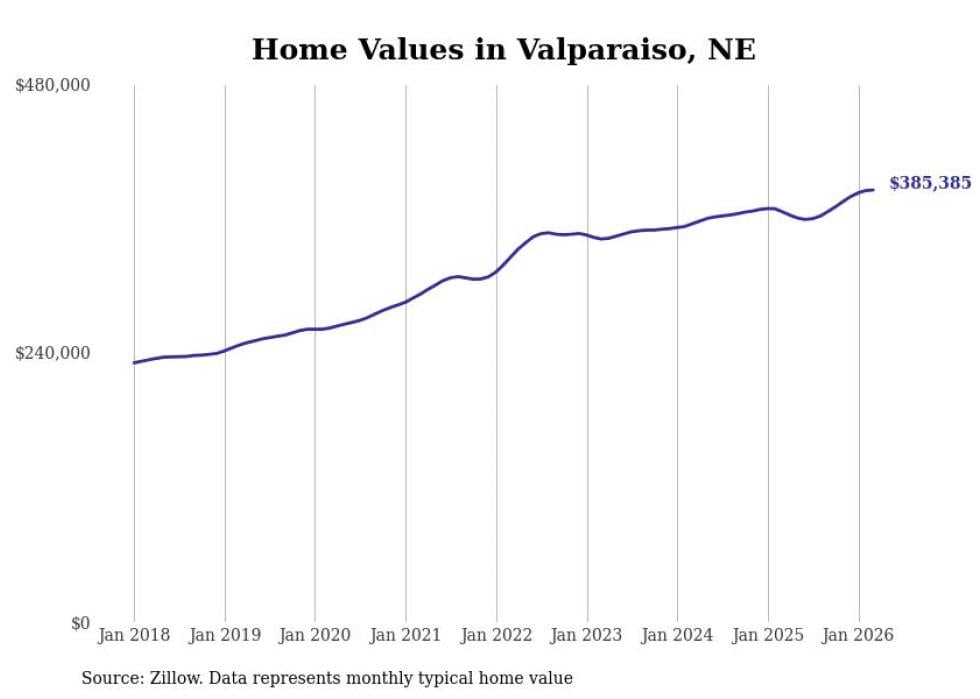
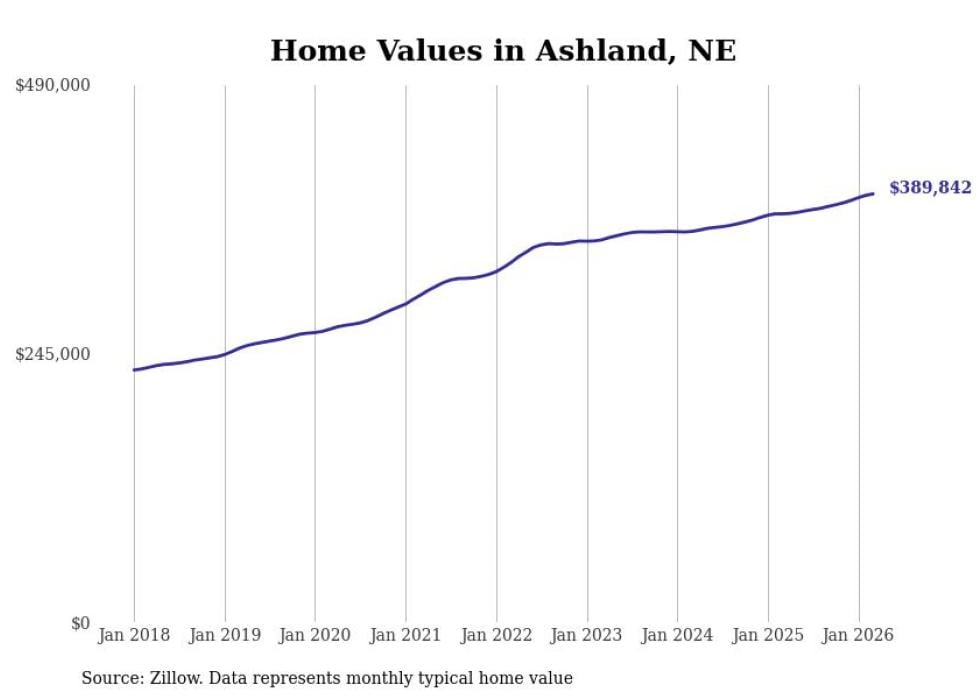
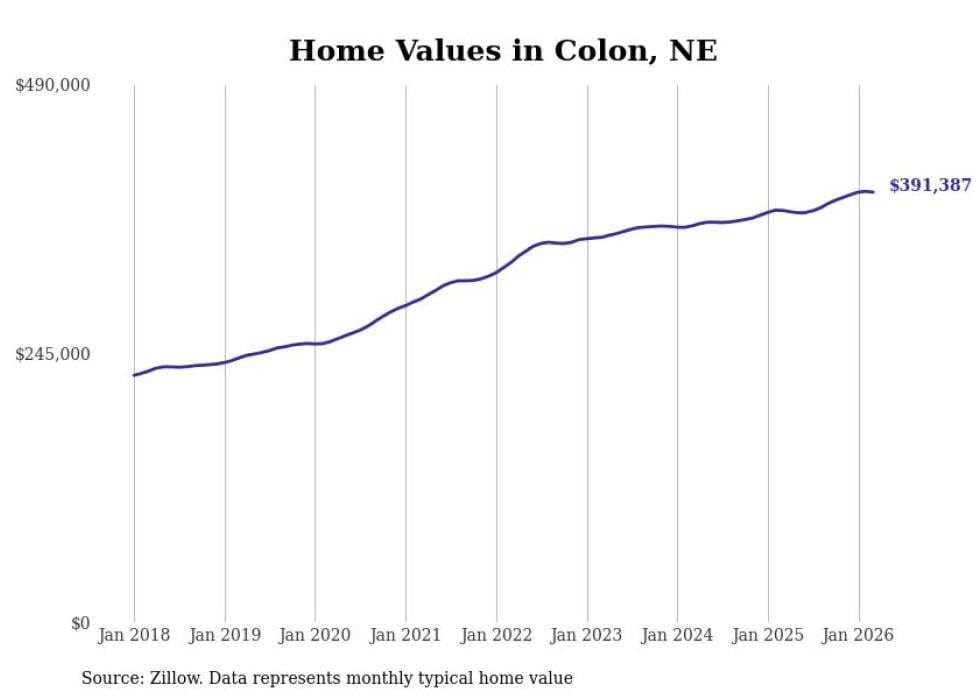
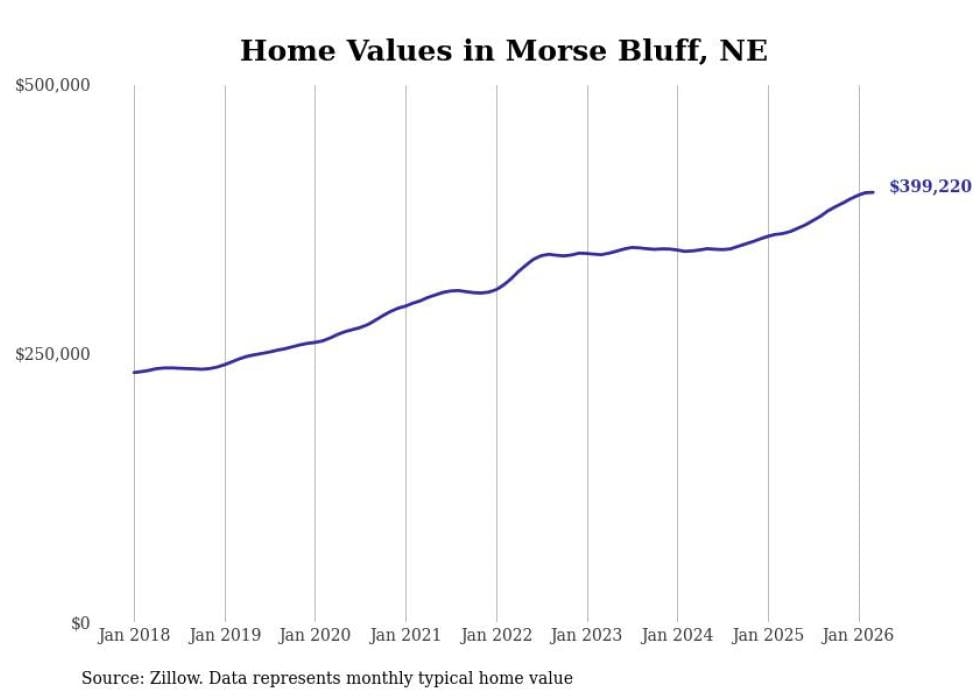
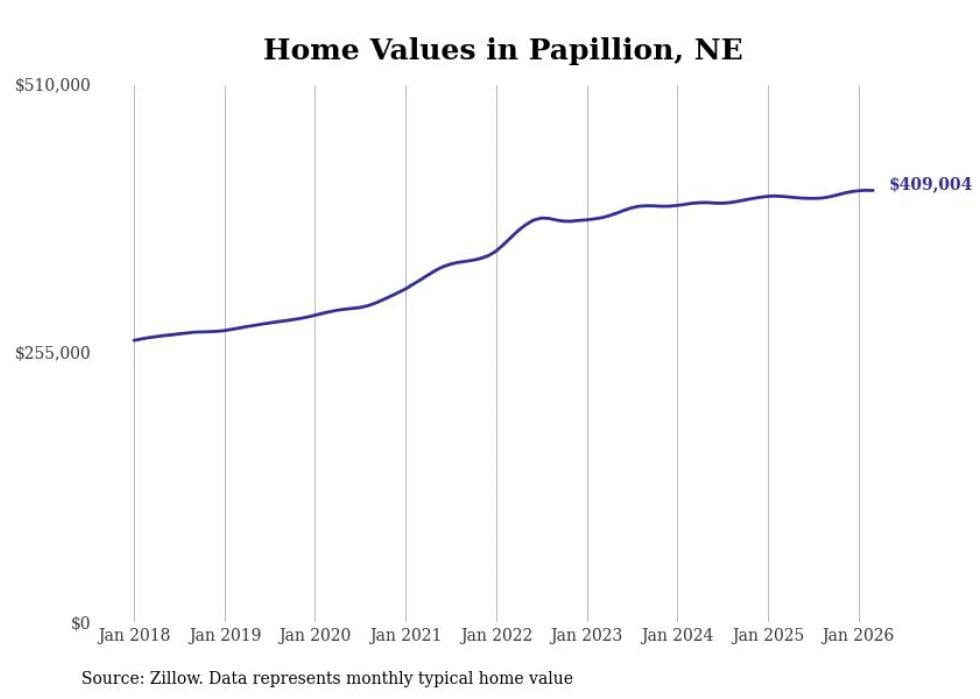
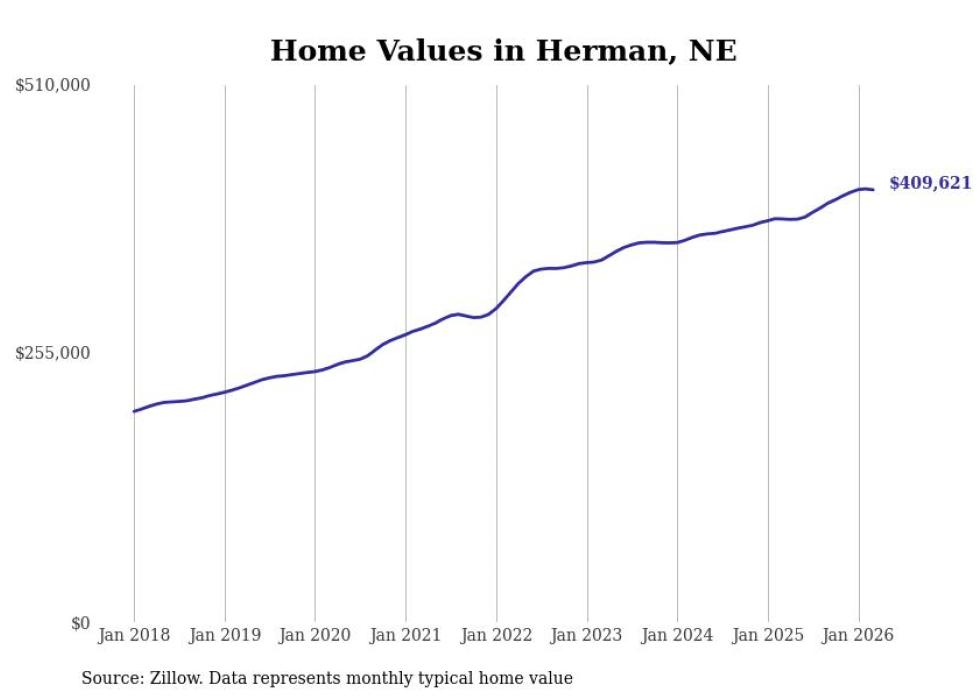
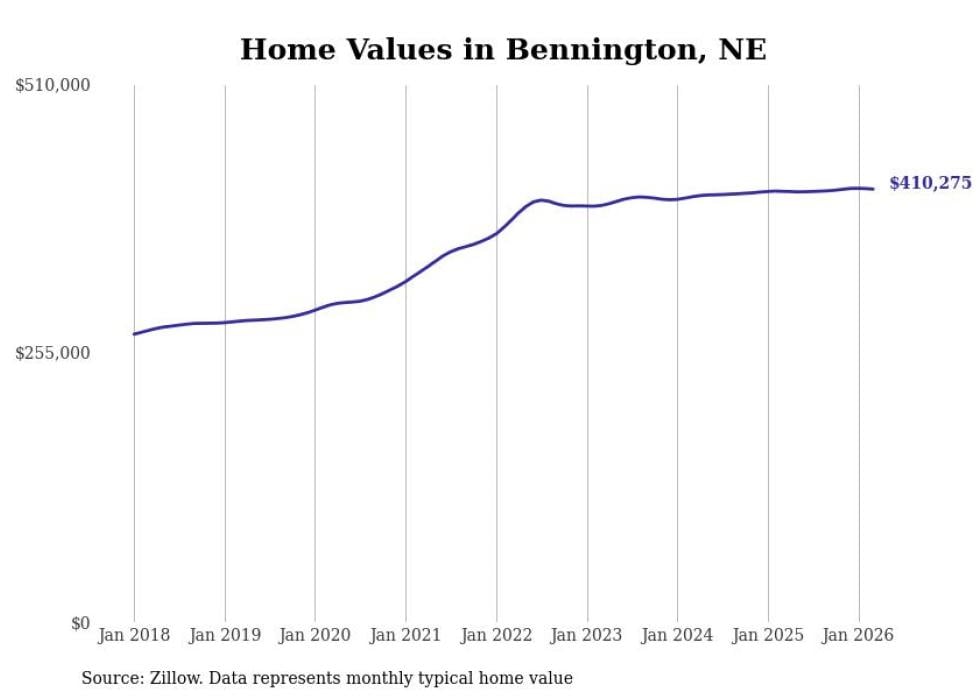
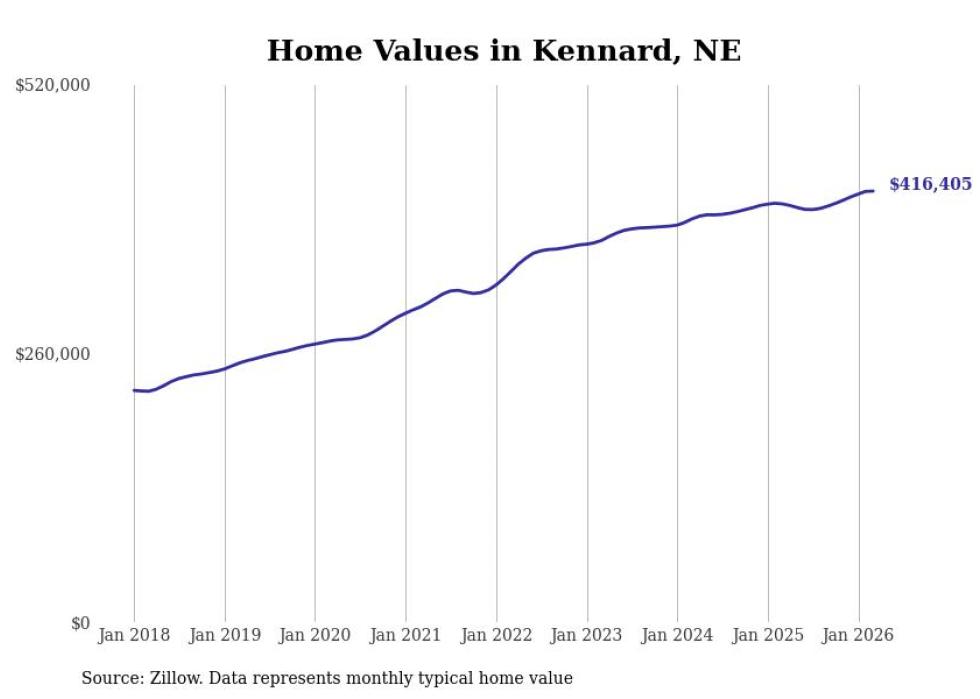
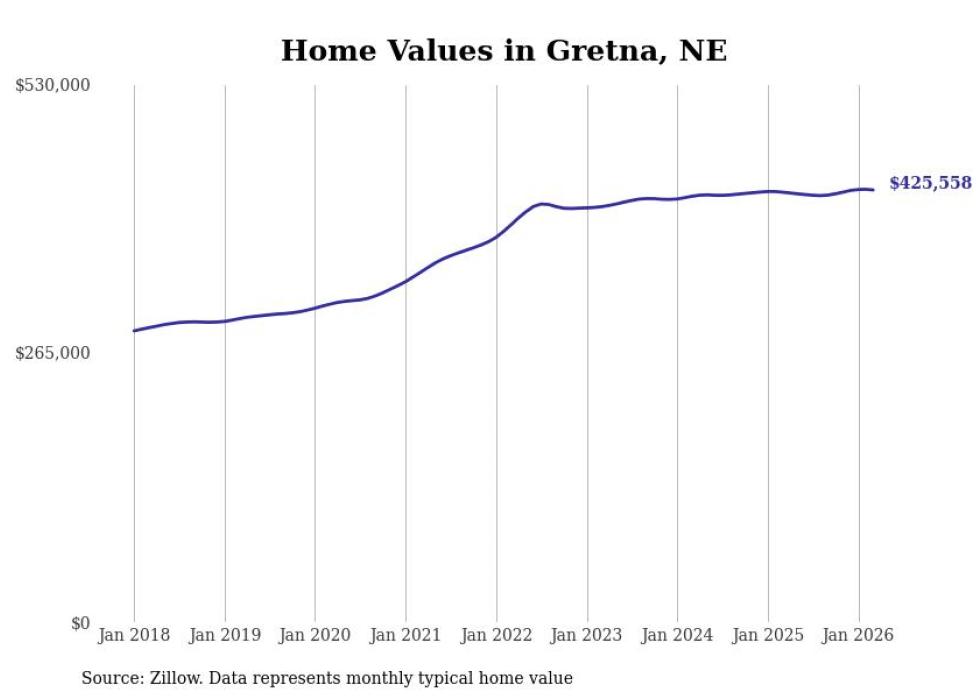
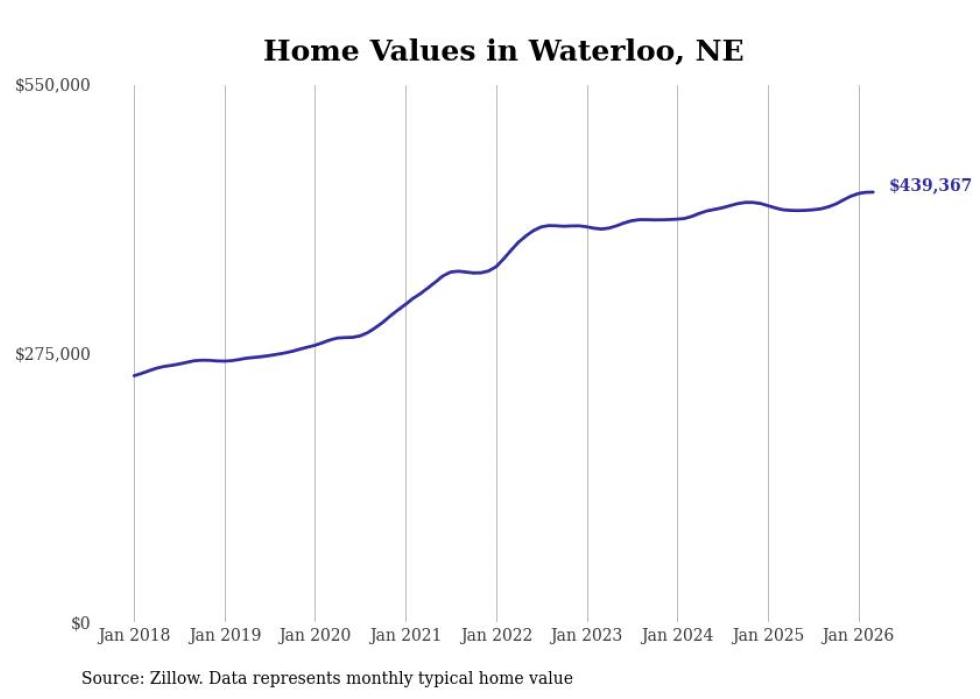
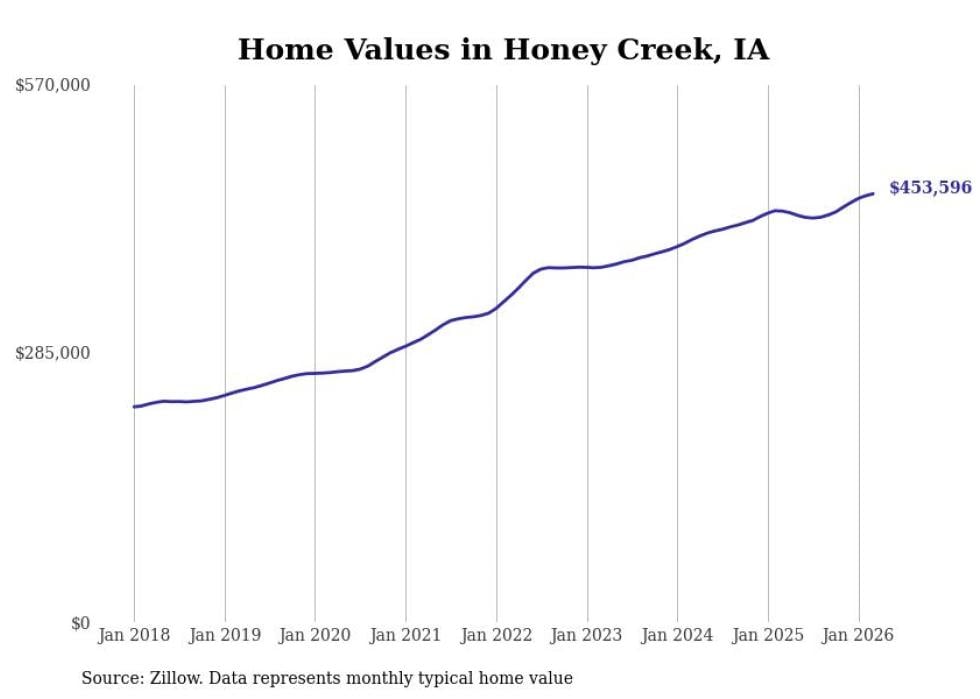
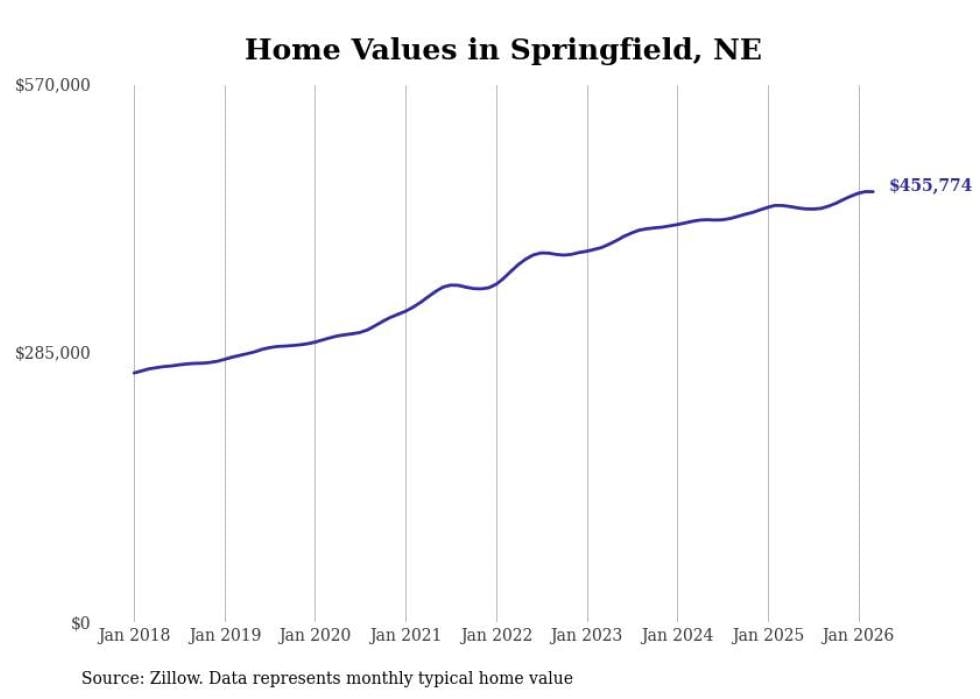
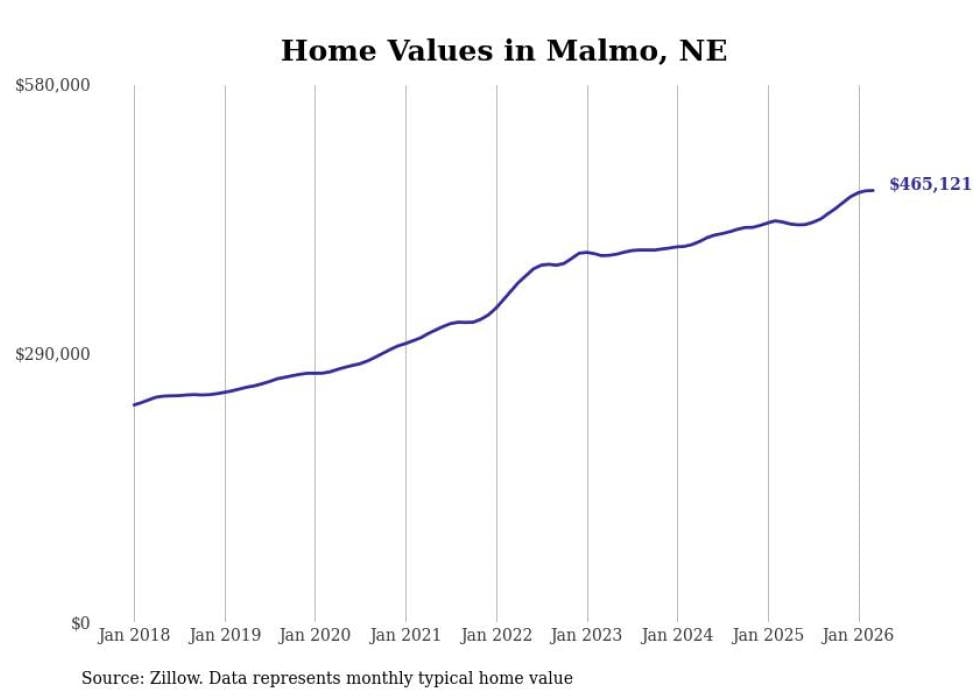
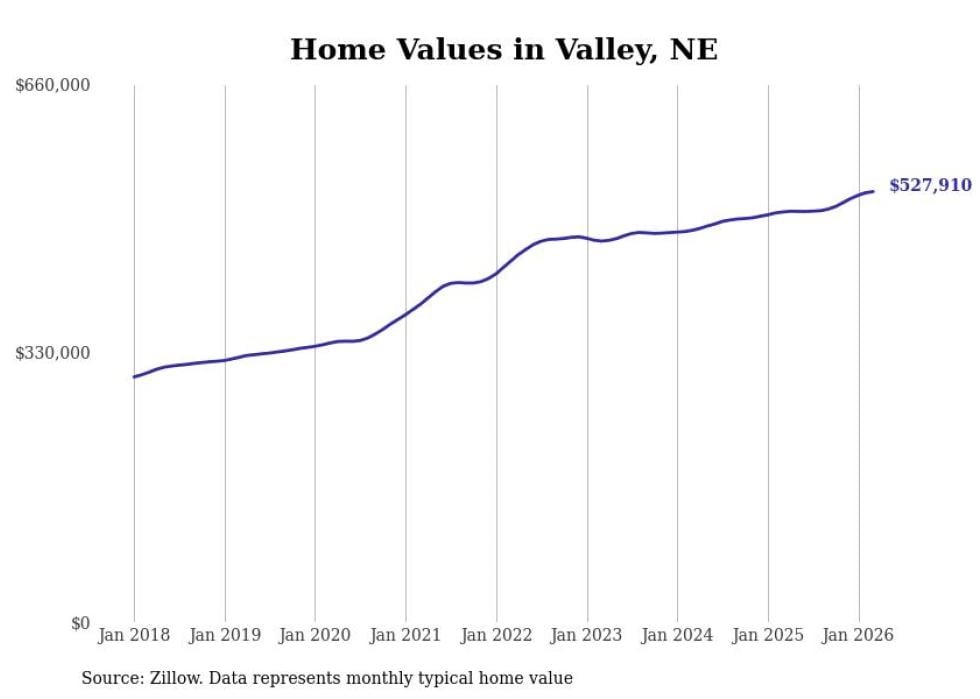
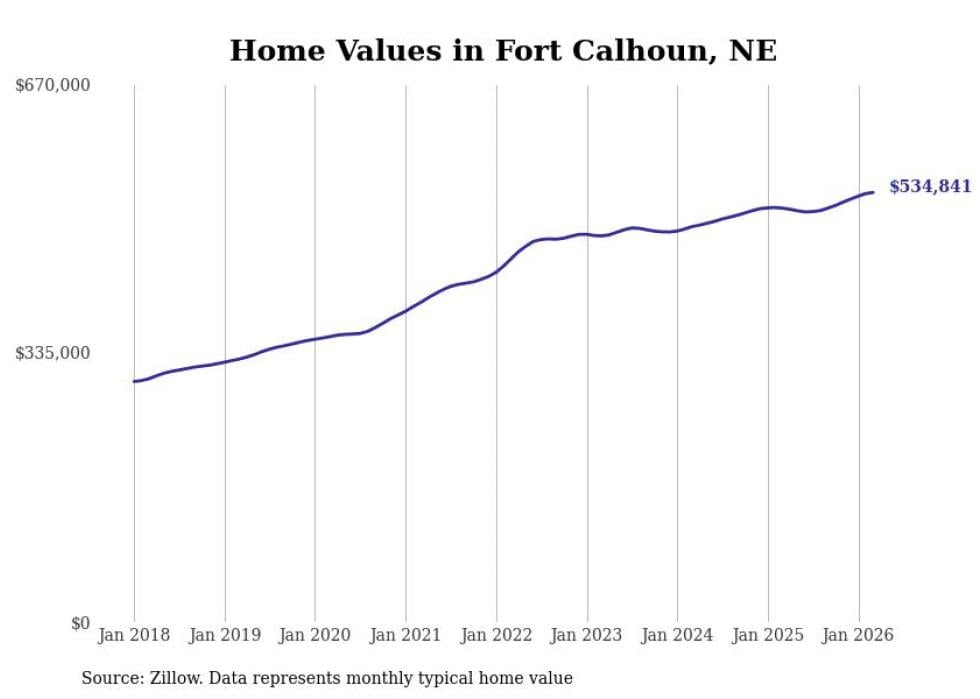
compiled a list of cities with the most expensive homes in the Omaha metro area using data from . Charts show the monthly typical home value since January 2018. Data was available for 77 cities and towns.

1 / 30
麻豆原创

#30. Linwood, NE

- Typical home value: $319,989
- 1-year price change: +4.2%
- 5-year price change: +50.1%

2 / 30
麻豆原创

#29. Weston, NE

- Typical home value: $328,060
- 1-year price change: +5.2%
- 5-year price change: +37.0%

3 / 30
麻豆原创

#28. Ceresco, NE

- Typical home value: $329,180
- 1-year price change: +3.4%
- 5-year price change: +32.7%

4 / 30
麻豆原创

#27. Treynor, IA

- Typical home value: $335,319
- 1-year price change: +2.4%
- 5-year price change: +36.5%

5 / 30
麻豆原创

#26. Union, NE

- Typical home value: $342,758
- 1-year price change: +3.5%
- 5-year price change: +33.0%

6 / 30
麻豆原创

#25. Louisville, NE

- Typical home value: $343,946
- 1-year price change: +3.6%
- 5-year price change: +31.2%

7 / 30
麻豆原创

#24. Ithaca, NE

- Typical home value: $346,884
- 1-year price change: +3.2%
- 5-year price change: +31.2%

8 / 30
麻豆原创

#23. Blair, NE

- Typical home value: $348,783
- 1-year price change: +2.8%
- 5-year price change: +33.3%

9 / 30
麻豆原创

#22. Eagle, NE

- Typical home value: $352,084
- 1-year price change: +3.2%
- 5-year price change: +30.6%

10 / 30
麻豆原创

#21. Cedar Creek, NE

- Typical home value: $358,624
- 1-year price change: +7.2%
- 5-year price change: +41.5%

11 / 30
麻豆原创

#20. Crescent, IA

- Typical home value: $361,468
- 1-year price change: +4.5%
- 5-year price change: +45.8%

12 / 30
麻豆原创

#19. Yutan, NE

- Typical home value: $362,539
- 1-year price change: +6.8%
- 5-year price change: +37.4%

13 / 30
麻豆原创

#18. Arlington, NE

- Typical home value: $363,742
- 1-year price change: +3.6%
- 5-year price change: +35.8%

14 / 30
麻豆原创

#17. Underwood, IA

- Typical home value: $372,918
- 1-year price change: +3.9%
- 5-year price change: +37.7%

15 / 30
麻豆原创

#16. Valparaiso, NE

- Typical home value: $375,573
- 1-year price change: +4.4%
- 5-year price change: +33.2%

16 / 30
麻豆原创

#15. South Bend, NE

- Typical home value: $378,547
- 1-year price change: +5.5%
- 5-year price change: +36.0%

17 / 30
麻豆原创

#14. Colon, NE

- Typical home value: $378,922
- 1-year price change: +4.6%
- 5-year price change: +34.6%

18 / 30
麻豆原创

#13. Ashland, NE

- Typical home value: $380,152
- 1-year price change: +4.5%
- 5-year price change: +32.3%

19 / 30
麻豆原创

#12. Morse Bluff, NE

- Typical home value: $386,825
- 1-year price change: +10.8%
- 5-year price change: +34.6%

20 / 30
麻豆原创

#11. Herman, NE

- Typical home value: $399,119
- 1-year price change: +7.4%
- 5-year price change: +49.0%

21 / 30
麻豆原创

#10. Papillion, NE

- Typical home value: $402,869
- 1-year price change: +1.3%
- 5-year price change: +27.9%

22 / 30
麻豆原创

#9. Bennington, NE

- Typical home value: $408,028
- 1-year price change: +0.6%
- 5-year price change: +25.5%

23 / 30
麻豆原创

#8. Kennard, NE

- Typical home value: $414,680
- 1-year price change: +2.8%
- 5-year price change: +38.0%

24 / 30
麻豆原创

#7. Gretna, NE

- Typical home value: $420,049
- 1-year price change: +0.5%
- 5-year price change: +25.5%

25 / 30
麻豆原创

#6. Waterloo, NE

- Typical home value: $430,030
- 1-year price change: +3.7%
- 5-year price change: +32.8%

26 / 30
麻豆原创

#5. Springfield, NE

- Typical home value: $446,646
- 1-year price change: +3.3%
- 5-year price change: +36.8%

27 / 30
麻豆原创

#4. Honey Creek, IA

- Typical home value: $447,228
- 1-year price change: +3.6%
- 5-year price change: +52.7%

28 / 30
麻豆原创

#3. Malmo, NE

- Typical home value: $451,538
- 1-year price change: +7.5%
- 5-year price change: +53.3%

29 / 30
麻豆原创

#2. Valley, NE

- Typical home value: $515,089
- 1-year price change: +4.9%
- 5-year price change: +37.4%

30 / 30
麻豆原创

#1. Fort Calhoun, NE

- Typical home value: $525,623
- 1-year price change: +3.3%
- 5-year price change: +35.9%

Trending Now