How gas prices have changed in Gloucester County, New Jersey in the last week
How gas prices have changed in Gloucester County, New Jersey in the last week
A combination of increased demand at the pump and the annual switchover to more expensive, but lower-emission summer fuel blends are driving the national cost for a gallon of gasoline higher this week.
The national average has risen several cents from a week ago and remains below the levels it was this , according to GasBuddy. Metros on the West Coast, as well as Illinois, Michigan, and Pennsylvania, are seeing the highest gas prices in the nation to begin this week.
A rise in the utilization of refineries producing gasoline this spring after a may be helping keep prices lower for travelers. When refinery utilization drops, it can raise the cost of gas; cold weather and storms took some plants offline this winter season.
compiled statistics on gas prices in Gloucester County using data from . Gas prices are current as of March 11.
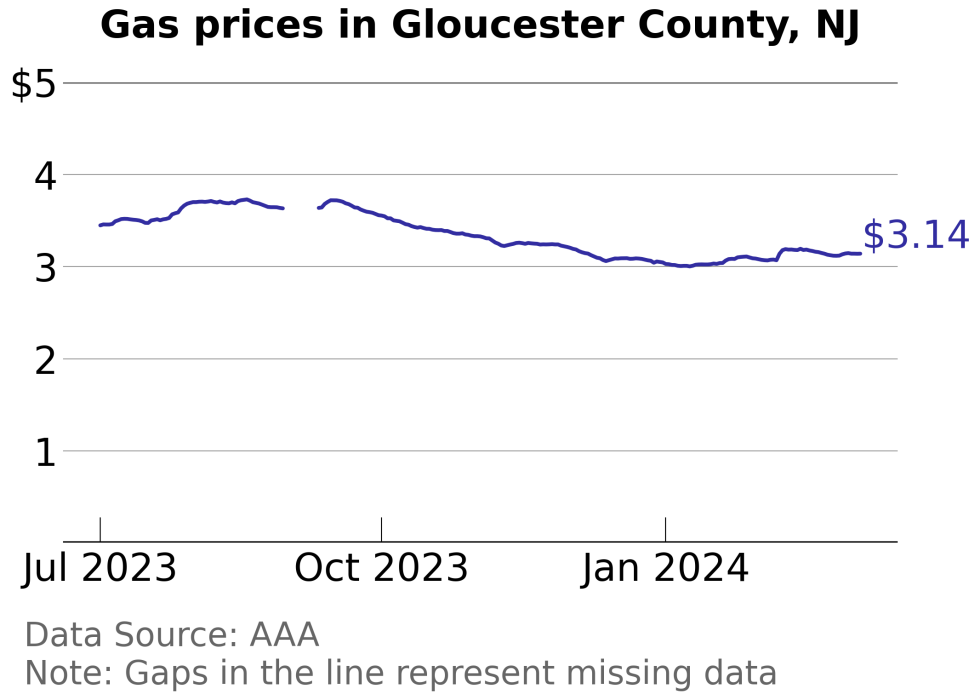
Gloucester County, New Jersey gas price trends
- Gas current price: $3.14
--- New Jersey average: $3.18
- Week change: +$0.02
- Month change: +$0.06
Counties with the most expensive gas in New Jersey
#1. Somerset County: $3.28
#2. Essex County: $3.28
#3. Cape May County: $3.23
#4. Hudson County: $3.21
#5. Ocean County: $3.21
Counties with the least expensive gas in New Jersey
#1. Warren County: $3.10
#2. Camden County: $3.12
#3. Sussex County: $3.13
#4. Gloucester County: $3.14
#5. Burlington County: $3.15
This story features writing by Dom DiFurio and is part of a series utilizing data automation across 3,038 counties.


