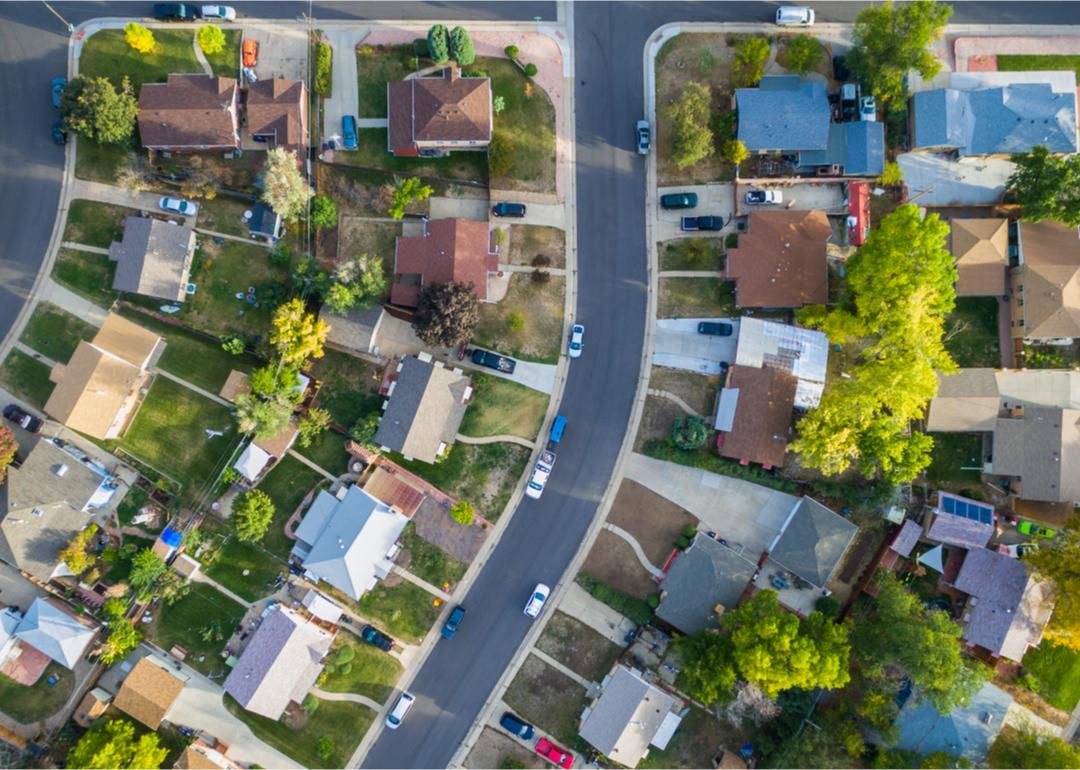
Places with the fastest growing home prices in Gloucester County, NJ
Places with the fastest growing home prices in Gloucester County, NJ
compiled a list of places with the fastest growing home prices in Gloucester County, NJ using data from . Places are ranked by the dollar change Zillow Home Values Index for all homes from May 2022 to May 2023. The ZVHI represents a seasonally adjusted price for the middle market for all homes. All 15 cities and towns with data available were included in the list.
#15. Gibbstown, NJ
- 1-year price change: +2.8% (+$7,329)
- 5-year price change: +43.2%
- Typical home value: $264,550
#14. Clayton, NJ
- 1-year price change: +4.6% (+$11,344)
- 5-year price change: +58.3%
- Typical home value: $255,975
#13. Wenonah, NJ
- 1-year price change: +4.1% (+$11,563)
- 5-year price change: +45.2%
- Typical home value: $296,335
#12. Westville, NJ
- 1-year price change: +6.2% (+$12,741)
- 5-year price change: +64.2%
- Typical home value: $217,194
#11. Glassboro, NJ
- 1-year price change: +4.5% (+$12,806)
- 5-year price change: +52.4%
- Typical home value: $300,190
#10. Newfield, NJ
- 1-year price change: +5.2% (+$12,813)
- 5-year price change: +54.3%
- Typical home value: $257,350
#9. Paulsboro, NJ
- 1-year price change: +7.7% (+$13,065)
- 5-year price change: +112.5%
- Typical home value: $183,080
#8. National Park, NJ
- 1-year price change: +7.4% (+$14,988)
- 5-year price change: +54.7%
- Typical home value: $218,752
#7. Williamstown, NJ
- 1-year price change: +5.2% (+$15,180)
- 5-year price change: +56.3%
- Typical home value: $306,609
#6. Swedesboro, NJ
- 1-year price change: +4.2% (+$16,336)
- 5-year price change: +48.9%
- Typical home value: $405,342
#5. Woodbury, NJ
- 1-year price change: +6.4% (+$16,706)
- 5-year price change: +70.0%
- Typical home value: $276,726
#4. West Deptford Township, NJ
- 1-year price change: +6.2% (+$17,236)
- 5-year price change: +46.6%
- Typical home value: $293,698
#3. Woodbury Heights, NJ
- 1-year price change: +7.3% (+$20,009)
- 5-year price change: +53.2%
- Typical home value: $292,591
#2. Mullica Hill, NJ
- 1-year price change: +5.2% (+$25,208)
- 5-year price change: +48.7%
- Typical home value: $509,965
#1. Pitman, NJ
- 1-year price change: +9.6% (+$26,295)
- 5-year price change: +58.1%
- Typical home value: $299,224


