Most dangerous states for driving

Written by:
October 1, 2020
Updated on October 2, 2020
Canva

This story originally appeared on Reviews.com and was produced and distributed in partnership with Âé¶¹Ô­´´ Studio.

Most dangerous states for driving

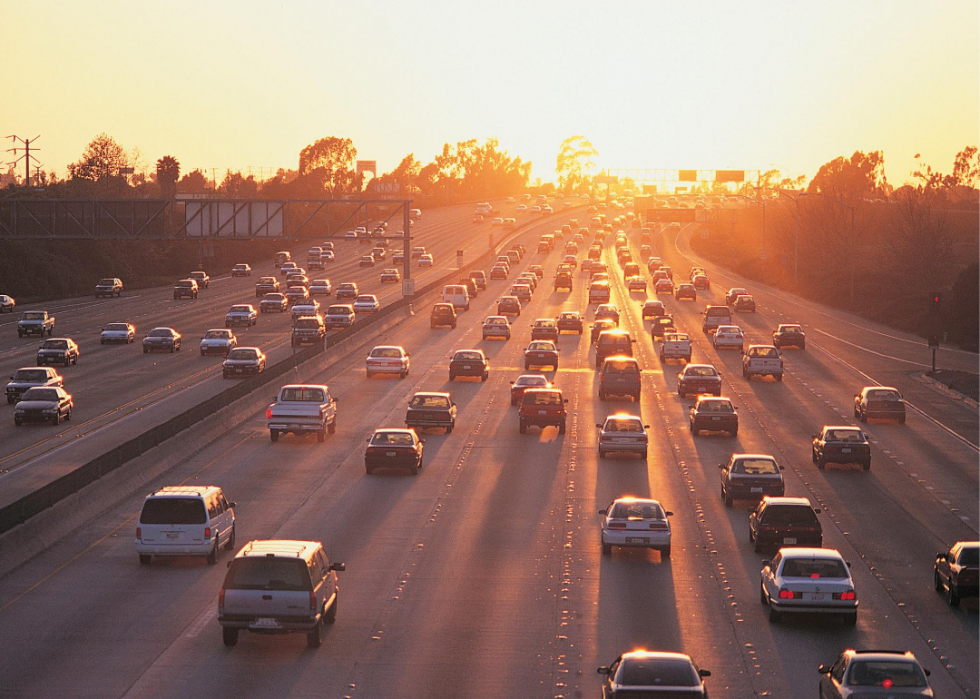
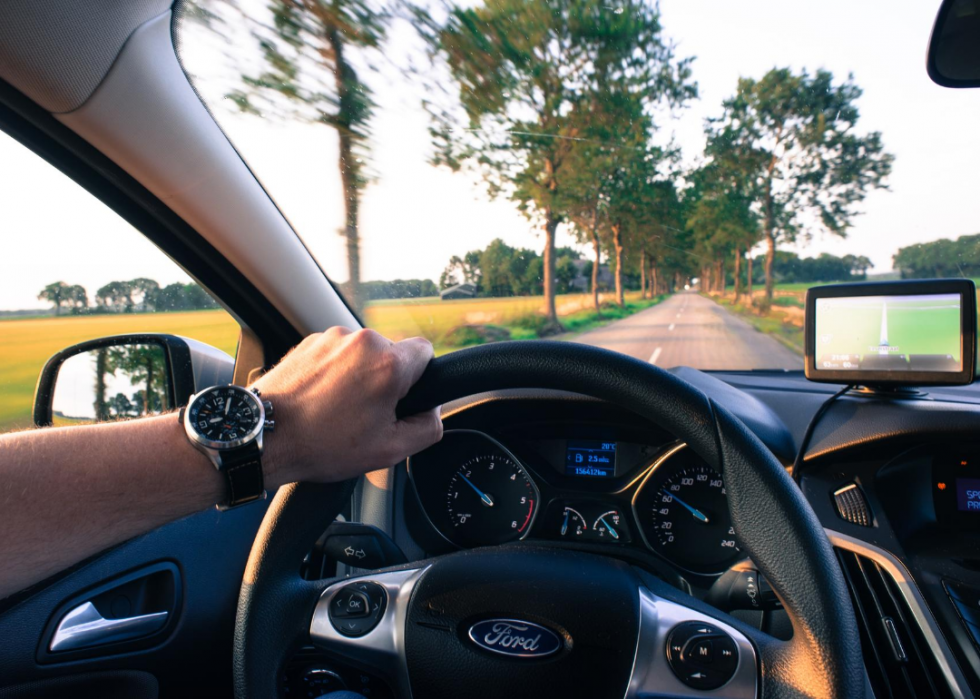
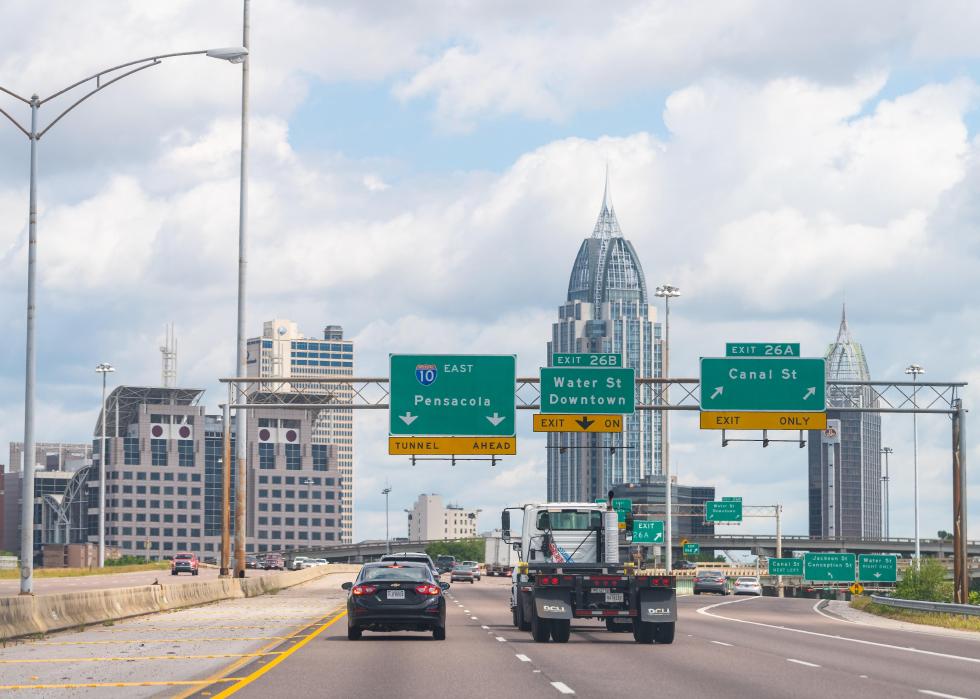
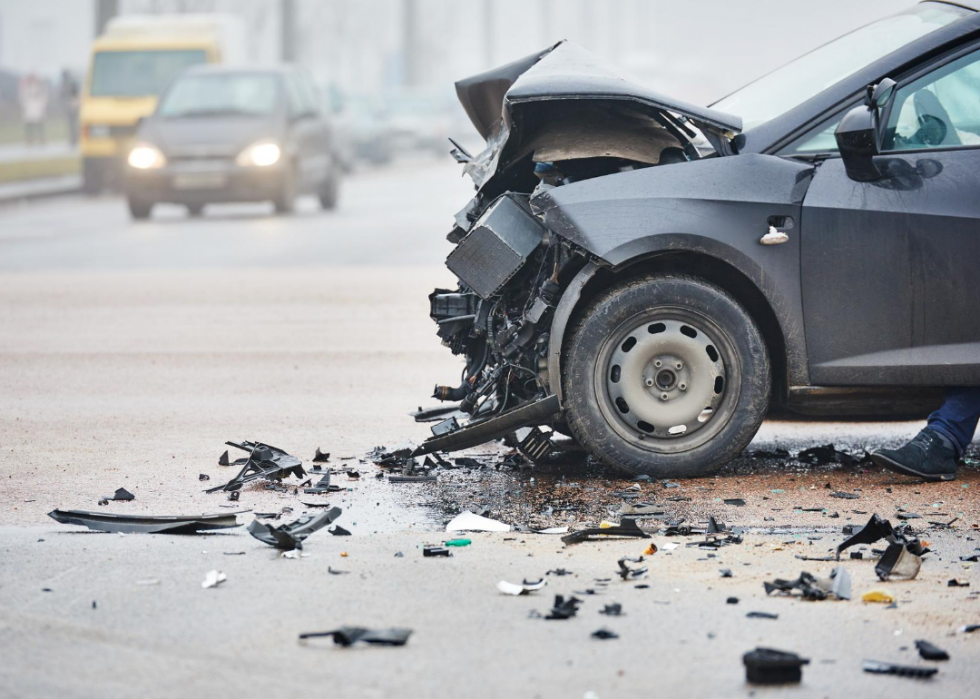
Here’s some good news for anyone about to hit the road for vacation: Car crashes across America are killing fewer people—especially children.

In 2018, yearly deaths from motor vehicle accidents fell by nearly 1,000 people from the previous year, and with a drop of more than 10% among children, from the National Highway Traffic Safety Administration. Fatalities related to speeding saw an almost 6% decline. Deaths from drunk driving dropped about 4% and made up just over a quarter of traffic deaths, the lowest percentage in more than 35 years.

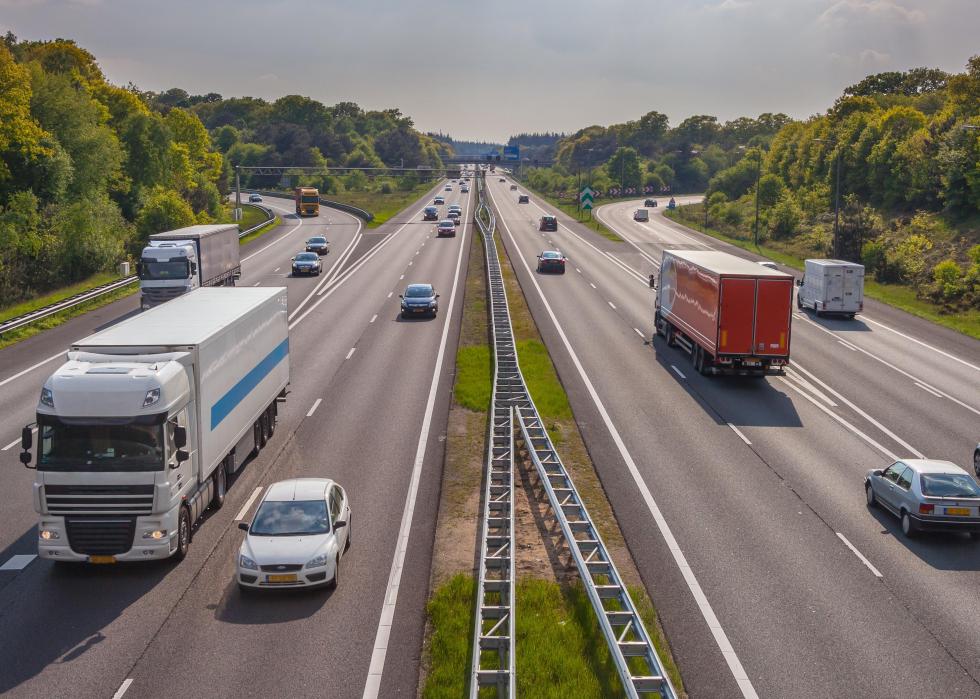
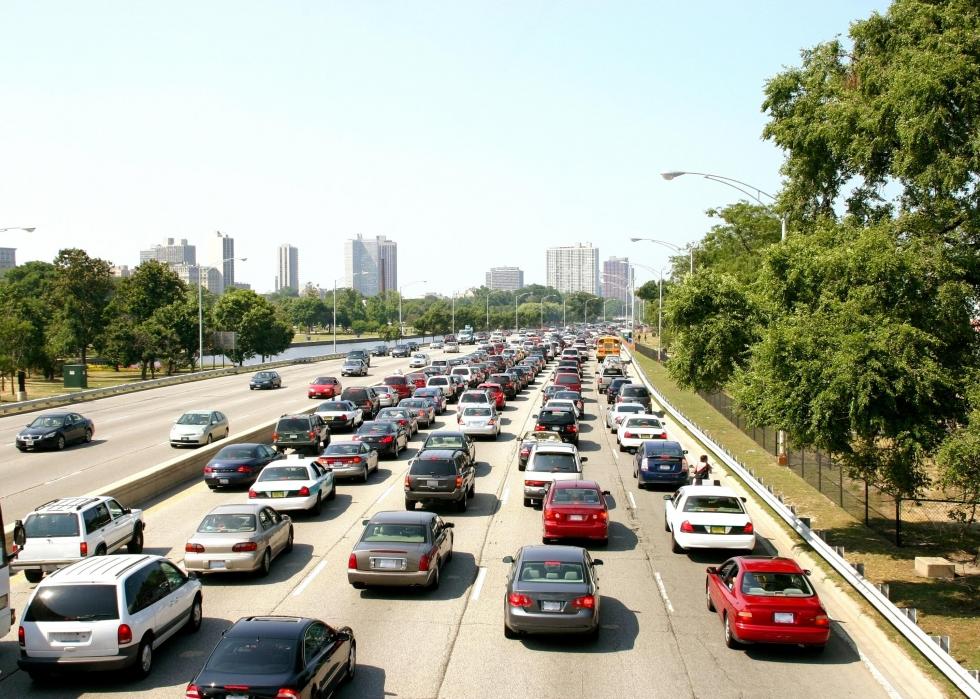
Those heartening statistics come even as people drive more and are part of a 40-year downward trend. Experts point to a raft of safety measures, from increased use of seat belts to vehicle improvements such as air bags and electronic stability control.

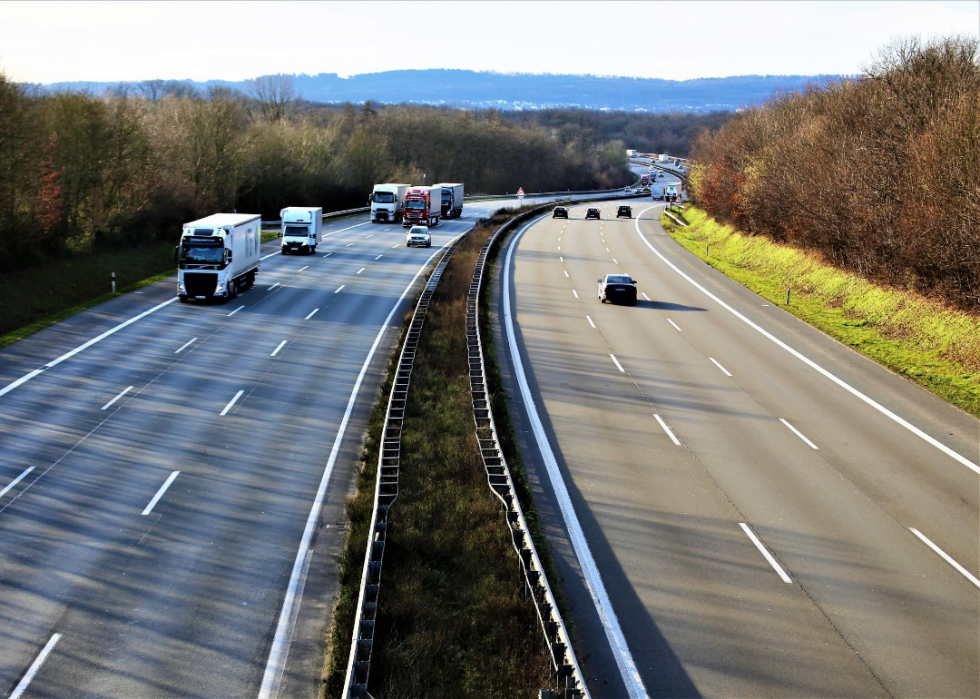
But there are some sober warnings among the numbers. More than 6,000 pedestrians died, the most since 1990, and motorcycle fatalities were up by almost 5%. The same was true for bicyclist deaths, which were up more than 6%, as well as an almost 1% increase for the occupants of large trucks.

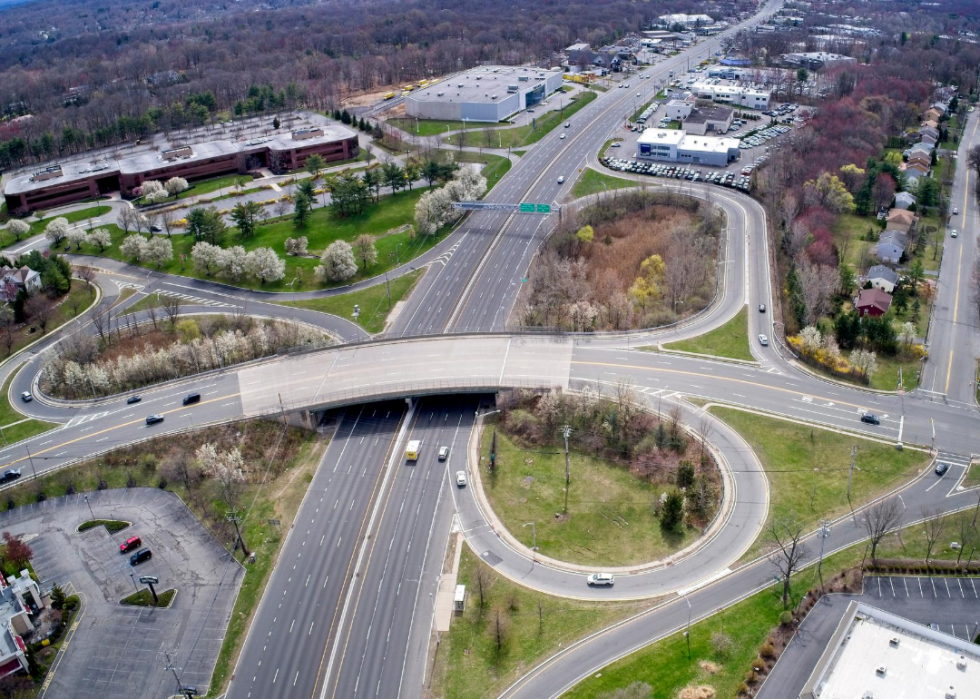
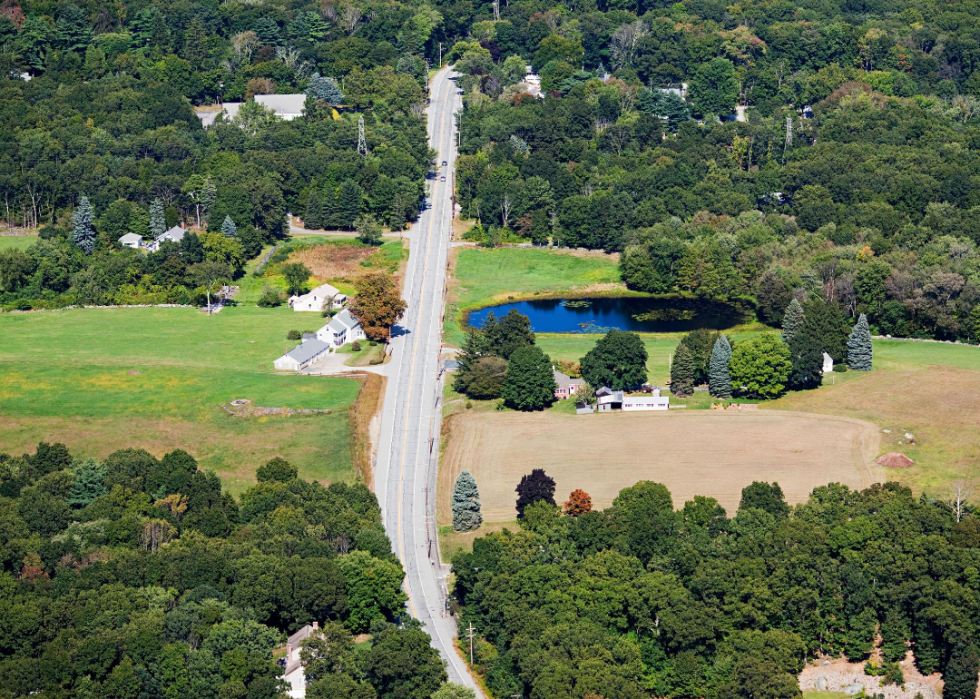
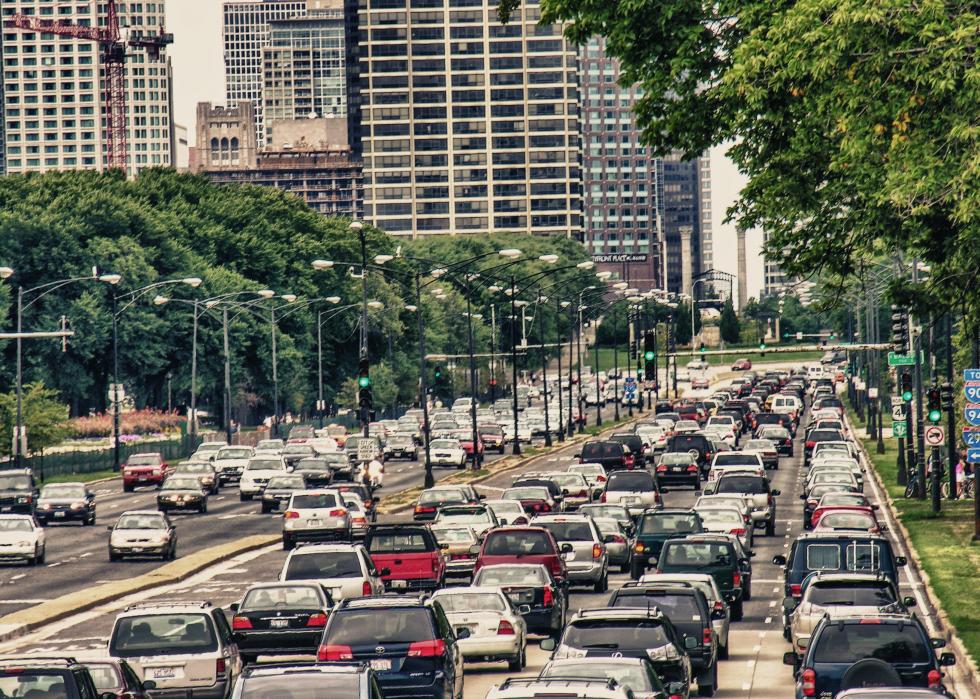
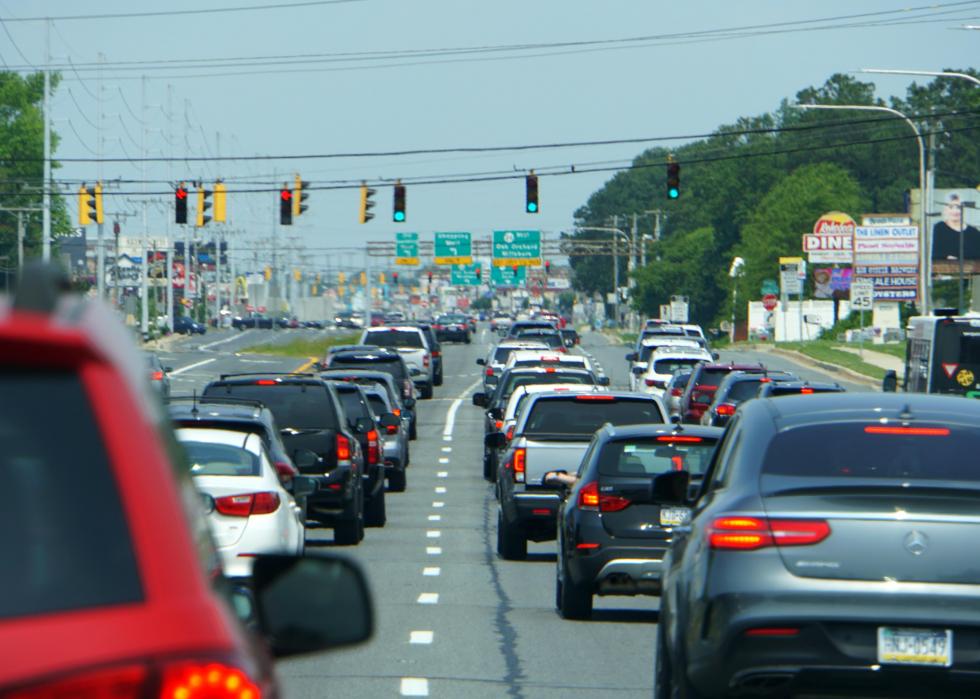
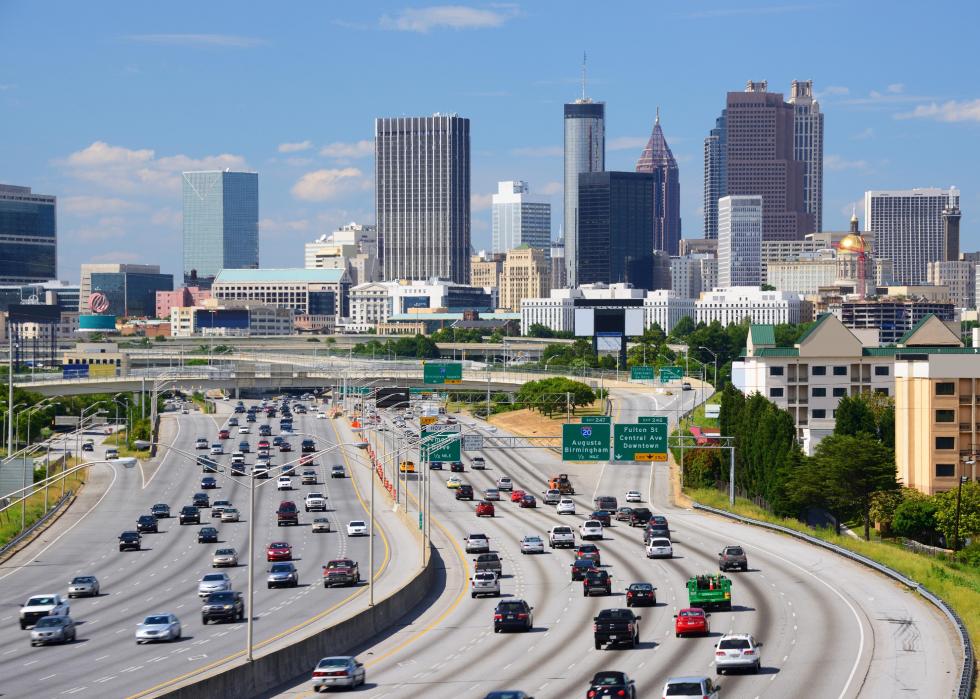
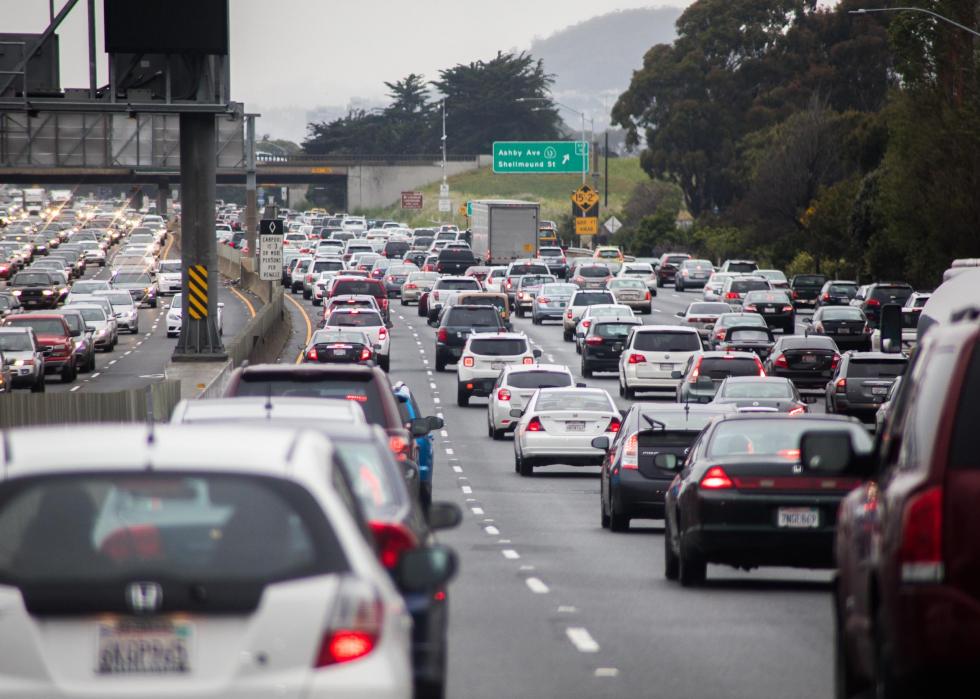
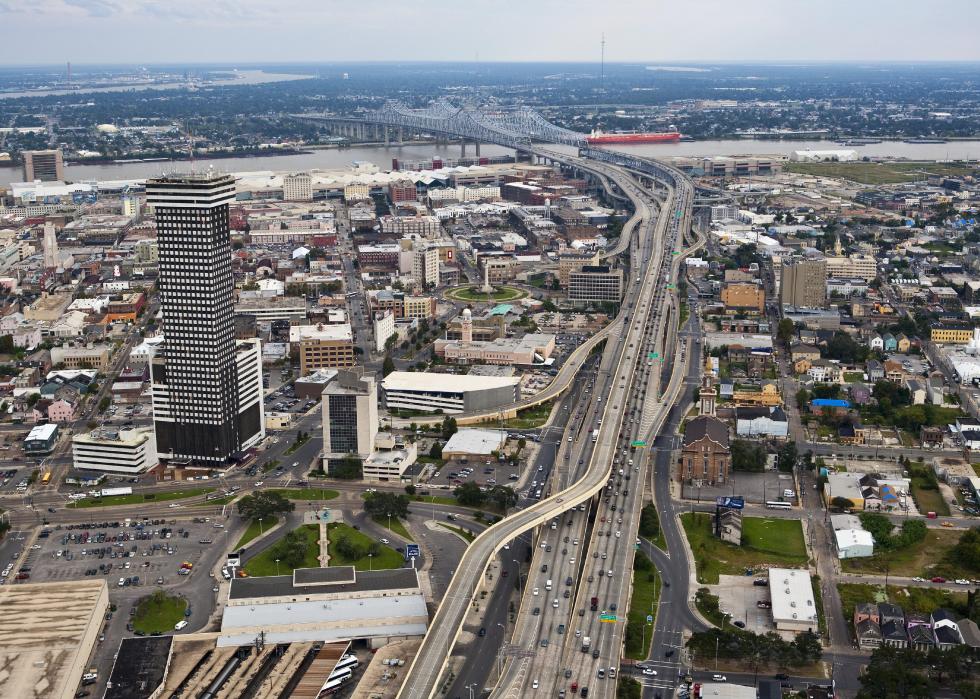
For those of you who live in cities, here is a trend to keep an eye on: Over the last decade, traffic deaths in urban neighborhoods have been on the rise, and have surpassed deaths in rural areas since 2016. Among the kinds of accidents that have become deadlier in cities, pedestrian deaths were up 69%, bicycling deaths were up 48%, and motorcycle deaths were up 33%.

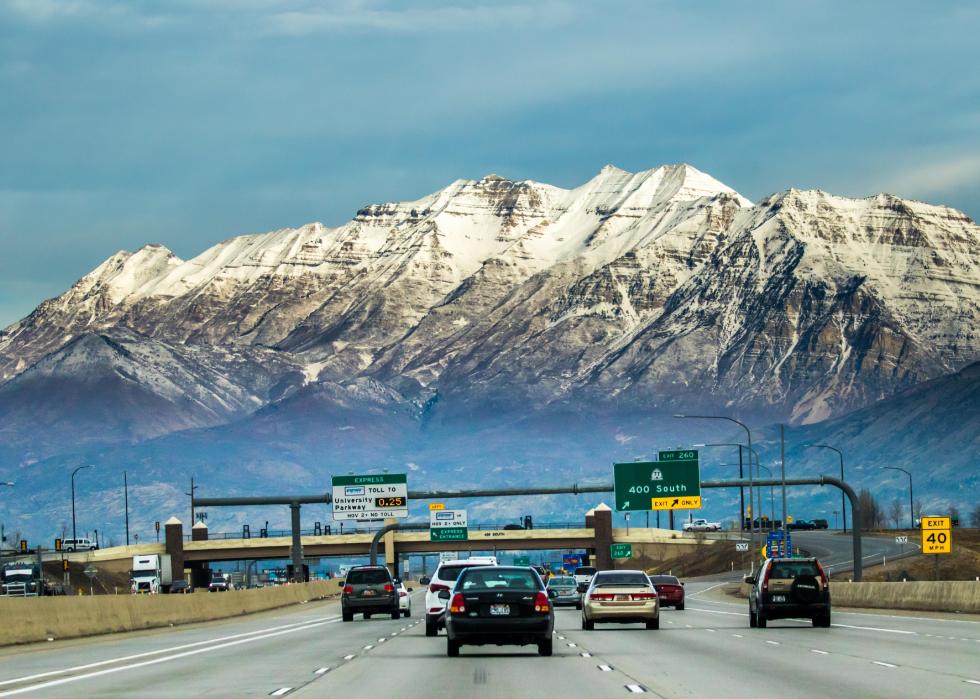
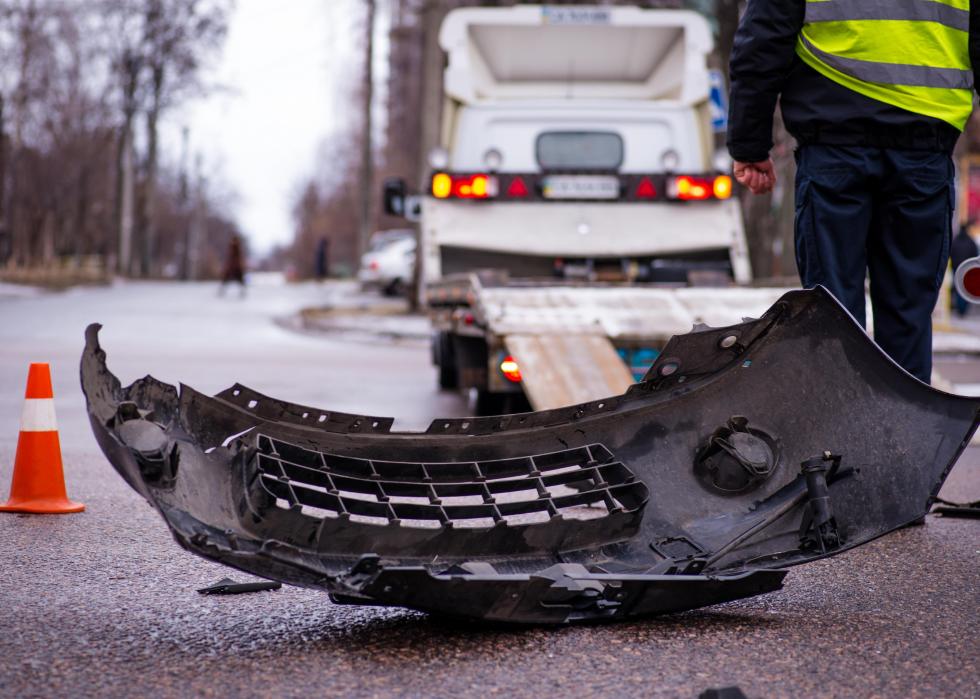
compiled a list of the most dangerous states for driving using data from the National Highway Traffic Safety Administration and from analysis by the . There were a total of 36,560 deaths as a result of motor vehicle crashes in the U.S. in 2018, the year these figures cover. States are ranked by 2018 fatalities per 100 million vehicle travel miles. The data was released in 2019.

Take a look at how your state compares, and always drive safely.

1 / 50
Canva

#50. Massachusetts

- Fatalities per 100 million vehicle miles: 0.54 (-80% change since 1975)
- Total fatalities: 360 (-58.0% change since 1975)
- Percent of fatalities related to speeding: 26.4% (#31 highest of all states)
- Percent of fatalities with a driver over .08 BAC: 33.3% (#8 highest of all states)
- Deaths by road user type: 49.1% car, 25.6% light trucks, 2.9% large trucks, 21.3% motorcycles, 1.1% other or unknown

A went into effect this year a decade after drivers were prohibited from sending or reading texts. Nearly three of every four Massachusetts drivers and front-seat passengers wear , and seat belt use across the country saved more than between 1975 and 2017. Massachusetts was also among the states with the lowest percentage of fatalities on rural roads.


2 / 50
Canva

#49. Minnesota

- Fatalities per 100 million vehicle miles: 0.63 (-79% change since 1975)
- Total fatalities: 381 (-49.0% change since 1975)
- Percent of fatalities related to speeding: 29.7% (#22 highest of all states)
- Percent of fatalities with a driver over .08 BAC: 27.6% (#28 highest of all states)
- Deaths by road user type: 41.3% car, 35.8% light trucks, 1.2% large trucks, 18.0% motorcycles, 3.7% other or unknown

Minnesotans are vigilant about seat belt use, with wearing them, above the national average. Police are allowed to stop drivers solely for failing to wear one, what’s known as a primary law. And as of last year, drivers in their hands.

Recently, though, in speeding, running red lights and stop signs, and crashes resulting in death.

3 / 50
Canva

#48. New Jersey

- Fatalities per 100 million vehicle miles: 0.73 (-66% change since 1975)
- Total fatalities: 564 (-46.0% change since 1975)
- Percent of fatalities related to speeding: 20.2% (#41 highest of all states)
- Percent of fatalities with a driver over .08 BAC: 22.2% (#45 highest of all states)
- Deaths by road user type: 54.2% car, 26.1% light trucks, 3.5% large trucks, 14.3% motorcycles, 1.9% other or unknown

New Jersey’s is just above the national average at 88%. It banned the handheld use of phones and has one of the country’s , which imposes restrictions on when a new driver can be on the road, limits how many passengers he or she can have, and prohibits any use of phones, handheld or hands-free.

4 / 50
Canva

#47. Rhode Island

- Fatalities per 100 million vehicle miles: 0.74 (-62% change since 1975)
- Total fatalities: 59 (-46.0% change since 1975)
- Percent of fatalities related to speeding: 45.8% (#3 highest of all states)
- Percent of fatalities with a driver over .08 BAC: 33.9% (#6 highest of all states)
- Deaths by road user type: 36.0% car, 24.0% light trucks, 0.0% large trucks, 36.0% motorcycles, 4.0% other or unknown

A group called Advocates for Highway and Auto Safety, an alliance of public safety, law enforcement, insurance companies, and other groups, gave Rhode Island , including a ban on texting and requiring seat belt use. What’s missing? Mandating helmets for motorcycle riders, nighttime restrictions for new drivers, and limiting an unrestricted license to those 18 and older.

5 / 50
Sean Pavone // Shutterstock

#46. New York

- Fatalities per 100 million vehicle miles: 0.76 (-79% change since 1975)
- Total fatalities: 943 (-60.0% change since 1975)
- Percent of fatalities related to speeding: 29.1% (#24 highest of all states)
- Percent of fatalities with a driver over .08 BAC: 32.6% (#10 highest of all states)
- Deaths by road user type: 45.6% car, 26.3% light trucks, 1.5% large trucks, 23.0% motorcycles, 3.6% other or unknown

New York City is cracking down on dangerous drivers. Those caught repeatedly speeding or running red lights could end up under a law passed this year. The first state in the country to mandate seat belt use in the front seat of a vehicle, New York will to all passengers over the age of 16 in November.

6 / 50
Bob Pool // Shutterstock

#45. Utah

- Fatalities per 100 million vehicle miles: 0.81 (-76% change since 1975)
- Total fatalities: 260 (-4.0% change since 1975)
- Percent of fatalities related to speeding: 26.9% (#30 highest of all states)
- Percent of fatalities with a driver over .08 BAC: 23.5% (#43 highest of all states)
- Deaths by road user type: 38.4% car, 32.9% light trucks, 3.7% large trucks, 21.5% motorcycles, 3.7% other or unknown

Home to the Church of Jesus Christ of Latter-day Saints, whose members are not supposed to drink alcohol, Utah has among the lowest percentages of among all traffic fatalities. In 2018, it became the first state to lower its drunk driving limit, or blood alcohol content, to , a from the National Transportation Safety Board.

7 / 50
Canva

#44. Maryland

- Fatalities per 100 million vehicle miles: 0.84 (-68% change since 1975)
- Total fatalities: 501 (-25.0% change since 1975)
- Percent of fatalities related to speeding: 24.6% (#35 highest of all states)
- Percent of fatalities with a driver over .08 BAC: 24.4% (#42 highest of all states)
- Deaths by road user type: 52.9% car, 27.1% light trucks, 2.5% large trucks, 17.0% motorcycles, 0.5% other or unknown

Maryland last year by increasing penalties for drivers with prior convictions and those who kill someone. Like Utah, it has one of the of alcohol-related driving fatalities in the U.S.

8 / 50
Canva

#43. Washington

- Fatalities per 100 million vehicle miles: 0.88 (-72% change since 1975)
- Total fatalities: 546 (-28.0% change since 1975)
- Percent of fatalities related to speeding: 32.8% (#16 highest of all states)
- Percent of fatalities with a driver over .08 BAC: 30.4% (#13 highest of all states)
- Deaths by road user type: 43.6% car, 34.4% light trucks, 2.1% large trucks, 18.9% motorcycles, 0.9% other or unknown

In the state of Washington, , with the percentage of drivers and front-seat passengers buckling up coming in at 97%. As of 2017, drivers cannot even while stopped in traffic (no drinking coffee or applying makeup, either). Washington has been out front on battling distracted driving, and more than a decade ago, it became the first state to ban texting while driving.

9 / 50
Song_about_summer // Shutterstock

#42. Wisconsin

- Fatalities per 100 million vehicle miles: 0.89 (-73% change since 1975)
- Total fatalities: 588 (-37.0% change since 1975)
- Percent of fatalities related to speeding: 31.6% (#17 highest of all states)
- Percent of fatalities with a driver over .08 BAC: 33.8% (#7 highest of all states)
- Deaths by road user type: 43.5% car, 35.2% light trucks, 2.7% large trucks, 15.8% motorcycles, 2.9% other or unknown

Wisconsin considers a first-time drunk driving offense a rather than a crime, which some lawmakers have been trying to change. The percentage of alcohol-impaired driving fatalities is than in any neighboring state. Some Wisconsin legislators also want to expand laws governing phone use while driving—texting has been banned since 2010, but now legislators have been considering legislation requiring all .

10 / 50
barbsimages // Shutterstock

#41. Connecticut

- Fatalities per 100 million vehicle miles: 0.93 (-56% change since 1975)
- Total fatalities: 294 (-24.0% change since 1975)
- Percent of fatalities related to speeding: 30.6% (#19 highest of all states)
- Percent of fatalities with a driver over .08 BAC: 39.1% (#3 highest of all states)
- Deaths by road user type: 52.8% car, 21.5% light trucks, 3.9% large trucks, 21.0% motorcycles, 0.9% other or unknown

Some 87% of Connecticut drivers and front-seat passengers wear their seat belts, just over the national average. The state’s Department of Public Health has recommended that be required to buckle up to improve safety. The percentage of fatal crashes involving a was one of the highest in the country in 2017—only Washington D.C.’s rate was higher.

11 / 50
All About Space // Shutterstock

#40. Maine

- Fatalities per 100 million vehicle miles: 0.93 (-70% change since 1975)
- Total fatalities: 137 (-39.0% change since 1975)
- Percent of fatalities related to speeding: 30.7% (#18 highest of all states)
- Percent of fatalities with a driver over .08 BAC: 30.7% (#11 highest of all states)
- Deaths by road user type: 41.4% car, 37.5% light trucks, 0.0% large trucks, 18.0% motorcycles, 3.1% other or unknown

Maine gets for its driving safety laws from the Advocates for Highway and Auto Safety, though it recommends requiring helmets for all motorcycle riders, placing restrictions on young drivers, and prohibiting open containers. A law requiring took effect last year, but the state’s transportation officials warn that has prevented the state from investing more in its roads and bridges, a potential hazard for drivers.

12 / 50
Isamare // Shutterstock

#39. Ohio

- Fatalities per 100 million vehicle miles: 0.93 (-66% change since 1975)
- Total fatalities: 1,068 (-40.0% change since 1975)
- Percent of fatalities related to speeding: 27.2% (#29 highest of all states)
- Percent of fatalities with a driver over .08 BAC: 27.5% (#29 highest of all states)
- Deaths by road user type: 50.3% car, 29.6% light trucks, 3.0% large trucks, 15.9% motorcycles, 1.2% other or unknown

Ohio is considering raising the age for a to 16-and-a-half from 16 so that teenagers would drive with a permit for a year instead of six months. Nonprofit Advocates for Highway and Auto Safety cited Ohio’s lack of graduated driver licensing as one reason for its poor showing in its on safety. The group also recommended tougher motorcycle and helmet laws, among other changes.

13 / 50
Canva

#38. Vermont

- Fatalities per 100 million vehicle miles: 0.93 (-78% change since 1975)
- Total fatalities: 68 (-52.0% change since 1975)
- Percent of fatalities related to speeding: 36.8% (#12 highest of all states)
- Percent of fatalities with a driver over .08 BAC: 22.1% (#47 highest of all states)
- Deaths by road user type: 54.8% car, 29.0% light trucks, 3.2% large trucks, 11.3% motorcycles, 1.6% other or unknown

Vermont had one of the highest percentages of in 2018. The state requires from the driver and all passengers. For the driver and front-seat passenger, compliance is at 84%, just under the national average.

14 / 50
Canva

#37. Michigan

- Fatalities per 100 million vehicle miles: 0.95 (-69% change since 1975)
- Total fatalities: 974 (-45.0% change since 1975)
- Percent of fatalities related to speeding: 25.2% (#34 highest of all states)
- Percent of fatalities with a driver over .08 BAC: 27.4% (#30 highest of all states)
- Deaths by road user type: 45.5% car, 33.9% light trucks, 1.2% large trucks, 17.7% motorcycles, 1.6% other or unknown

Michigan’s seat belt law was passed 35 years ago, but the home of the auto industry initially fought the new regulation. Today, compliance is high at 94%. The number of Michigan’s rose by more than 10% in 2018, with most taking place on local roads, spurring Mothers Against Drunk Driving to call on state lawmakers to (which measure alcohol levels) for all convicted drunk drivers.

15 / 50
GagliardiPhotography // Shutterstock

#36. Illinois

- Fatalities per 100 million vehicle miles: 0.96 (-73% change since 1975)
- Total fatalities: 1,031 (-49.0% change since 1975)
- Percent of fatalities related to speeding: 42.1% (#6 highest of all states)
- Percent of fatalities with a driver over .08 BAC: 30.0% (#16 highest of all states)
- Deaths by road user type: 48.1% car, 31.2% light trucks, 3.7% large trucks, 14.2% motorcycles, 2.8% other or unknown

Last year, Illinois defined the use of any kind of handheld electronic device while driving, including phones, as . Your license can be suspended after you receive three tickets in a year. Hands-free calls are allowed.

16 / 50
thodonal88 // Shutterstock

#35. Iowa

- Fatalities per 100 million vehicle miles: 0.96 (-74% change since 1975)
- Total fatalities: 318 (-53.0% change since 1975)
- Percent of fatalities related to speeding: 19.5% (#43 highest of all states)
- Percent of fatalities with a driver over .08 BAC: 26.7% (#31 highest of all states)
- Deaths by road user type: 40.1% car, 37.0% light trucks, 2.8% large trucks, 14.9% motorcycles, 5.1% other or unknown

Iowa is considering to make it illegal to use a phone except hands-free, though you would be allowed to accept or disconnect a call. prohibit the use of handheld phones while driving, covering all drivers.

17 / 50
Mattsociety // Shutterstock

#34. Virginia

- Fatalities per 100 million vehicle miles: 0.96 (-67% change since 1975)
- Total fatalities: 820 (-17.0% change since 1975)
- Percent of fatalities related to speeding: 29.4% (#23 highest of all states)
- Percent of fatalities with a driver over .08 BAC: 29.3% (#20 highest of all states)
- Deaths by road user type: 48.6% car, 32.3% light trucks, 3.6% large trucks, 14.6% motorcycles, 0.8% other or unknown

Virginia drivers face a , including phones, while driving. The new law brings the state in line with Maryland, Washington D.C., and about. Virginia is also making it more expensive to speed.

18 / 50
TierneyMJ // Shutterstock

#33. California

- Fatalities per 100 million vehicle miles: 1.02 (-67% change since 1975)
- Total fatalities: 3,563 (-13.0% change since 1975)
- Percent of fatalities related to speeding: 26.0% (#32 highest of all states)
- Percent of fatalities with a driver over .08 BAC: 30.0% (#15 highest of all states)
- Deaths by road user type: 49.1% car, 28.4% light trucks, 1.8% large trucks, 19.7% motorcycles, 1.0% other or unknown

California is taking new steps to confront distracted driving. that goes into effect next year, drivers caught using a handheld phone could see a point added to their licenses—if the offense occurs within 36 months of a previous conviction.

19 / 50
Canva

#32. Indiana

- Fatalities per 100 million vehicle miles: 1.05 (-65% change since 1975)
- Total fatalities: 858 (-24.0% change since 1975)
- Percent of fatalities related to speeding: 21.9% (#39 highest of all states)
- Percent of fatalities with a driver over .08 BAC: 26.5% (#32 highest of all states)
- Deaths by road user type: 46.2% car, 32.4% light trucks, 3.4% large trucks, 16.4% motorcycles, 1.6% other or unknown

Of a total of 435 drivers killed, Indiana reported a blood alcohol concentration for only 115. At 26%, Indiana’s is the lowest in the country and compares to a high of 100% for Washington D.C. Nationally, the rate was 65%.

20 / 50
Canva

#31. Wyoming

- Fatalities per 100 million vehicle miles: 1.06 (-80% change since 1975)
- Total fatalities: 111 (-47.0% change since 1975)
- Percent of fatalities related to speeding: 34.2% (#13 highest of all states)
- Percent of fatalities with a driver over .08 BAC: 30.6% (#12 highest of all states)
- Deaths by road user type: 23.8% car, 49.5% light trucks, 9.5% large trucks, 14.3% motorcycles, 2.9% other or unknown

When it comes to the different types of vehicles in fatal crashes, Wyoming saw its highest percentage of deaths among drivers and passengers in . A much lower percentage of deaths involved those traveling in cars.

21 / 50
Ekaterina Kondratova // Shutterstock

#30. Hawaii

- Fatalities per 100 million vehicle miles: 1.07 (-69% change since 1975)
- Total fatalities: 117 (-19.0% change since 1975)
- Percent of fatalities related to speeding: 43.6% (#4 highest of all states)
- Percent of fatalities with a driver over .08 BAC: 29.9% (#17 highest of all states)
- Deaths by road user type: 22.5% car, 29.6% light trucks, 0.0% large trucks, 47.9% motorcycles, 0.0% other or unknown

Hawaii had the highest percentage of among its fatalities at 36% and a high percentage of motorcycle deaths at 29%. By contrast, the percentage of deaths in cars, SUVs and pickups was relatively low. Critics say Hawaii needs a universal helmet law, as in the current one covers .

22 / 50
Rudmer Zwerver // Shutterstock

#29. New Hampshire

- Fatalities per 100 million vehicle miles: 1.07 (-62% change since 1975)
- Total fatalities: 147 (-3.0% change since 1975)
- Percent of fatalities related to speeding: 48.3% (#2 highest of all states)
- Percent of fatalities with a driver over .08 BAC: 32.7% (#9 highest of all states)
- Deaths by road user type: 40.6% car, 33.1% light trucks, 5.3% large trucks, 21.1% motorcycles, 0.0% other or unknown

Seat belts are required of drivers and front-seat passengers everywhere in the U.S. , which has no seat belt law governing adults. Only 69% of New Hampshire drivers and front-seat passengers wear them, well below the national average of 86%. New Hampshire also had the lowest seat belt use among at only 28%.

23 / 50
Peshkova // Shutterstock

#28. North Dakota

- Fatalities per 100 million vehicle miles: 1.07 (-71% change since 1975)
- Total fatalities: 105 (-37.0% change since 1975)
- Percent of fatalities related to speeding: 38.1% (#10 highest of all states)
- Percent of fatalities with a driver over .08 BAC: 27.6% (#27 highest of all states)
- Deaths by road user type: 22.7% car, 55.7% light trucks, 3.1% large trucks, 16.5% motorcycles, 2.1% other or unknown

North Dakota was one of three states with the highest percentage of deaths from at 87%—the others were South Dakota (90%) and Vermont (88%). Across the country, 45% of vehicular deaths occurred in rural areas.

24 / 50
Khairil Azhar Junos // Shutterstock

#27. Delaware

- Fatalities per 100 million vehicle miles: 1.09 (-68% change since 1975)
- Total fatalities: 111 (-9.0% change since 1975)
- Percent of fatalities related to speeding: 29.7% (#21 highest of all states)
- Percent of fatalities with a driver over .08 BAC: 25.2% (#38 highest of all states)
- Deaths by road user type: 43.2% car, 33.3% light trucks, 1.2% large trucks, 21.0% motorcycles, 1.2% other or unknown

Delaware has had a in place since 2011. Drivers may not use phones, laptops, games, or other electronic devices while driving, and fines start at $100 for a first offense.

25 / 50
marekuliasz // Shutterstock

#26. Nebraska

- Fatalities per 100 million vehicle miles: 1.10 (-67% change since 1975)
- Total fatalities: 230 (-38.0% change since 1975)
- Percent of fatalities related to speeding: 12.6% (#48 highest of all states)
- Percent of fatalities with a driver over .08 BAC: 28.7% (#21 highest of all states)
- Deaths by road user type: 42.2% car, 37.9% light trucks, 5.8% large trucks, 11.2% motorcycles, 2.9% other or unknown

Most deaths from motor vehicle crashes in 2018 involved only one vehicle. Nebraska, however, , the highest percentage in the country.

26 / 50
ESB Professional // Shutterstock

#25. Georgia

- Fatalities per 100 million vehicle miles: 1.14 (-67% change since 1975)
- Total fatalities: 1,504 (+11.0% change since 1975)
- Percent of fatalities related to speeding: 17.8% (#44 highest of all states)
- Percent of fatalities with a driver over .08 BAC: 24.9% (#40 highest of all states)
- Deaths by road user type: 44.8% car, 37.5% light trucks, 2.8% large trucks, 12.7% motorcycles, 2.2% other or unknown

Georgia has had a in place since 2018. The state had forbidden texting while driving in 2010, but critics there and elsewhere said such a ban was unenforceable since drivers can still use their hands to place calls.

27 / 50
Canva

#24. Colorado

- Fatalities per 100 million vehicle miles: 1.17 (-67% change since 1975)
- Total fatalities: 632 (+9.0% change since 1975)
- Percent of fatalities related to speeding: 33.2% (#15 highest of all states)
- Percent of fatalities with a driver over .08 BAC: 29.7% (#18 highest of all states)
- Deaths by road user type: 34.0% car, 43.3% light trucks, 2.5% large trucks, 19.8% motorcycles, 0.4% other or unknown

Colorado is considering a while driving. A 2017 survey by the Colorado Department of Transportation found that 89% of the state’s drivers admitted to in the previous seven days before being surveyed.

28 / 50
Peter James Sampson // Shutterstock

#23. Nevada

- Fatalities per 100 million vehicle miles: 1.17 (-75% change since 1975)
- Total fatalities: 330 (+51.0% change since 1975)
- Percent of fatalities related to speeding: 27.9% (#26 highest of all states)
- Percent of fatalities with a driver over .08 BAC: 26.4% (#33 highest of all states)
- Deaths by road user type: 42.4% car, 29.8% light trucks, 1.3% large trucks, 24.8% motorcycles, 1.7% other or unknown

Nevada enacted , among them a helmet requirement for moped riders on state roads, the prosecution of reckless driving in parking lots and other places open to the public, and a requirement for motorists approaching a traffic accident to slow down and move over.

29 / 50
irin-k // Shutterstock

#22. Pennsylvania

- Fatalities per 100 million vehicle miles: 1.17 (-64% change since 1975)
- Total fatalities: 1,190 (-43.0% change since 1975)
- Percent of fatalities related to speeding: 38.2% (#9 highest of all states)
- Percent of fatalities with a driver over .08 BAC: 28.1% (#24 highest of all states)
- Deaths by road user type: 47.5% car, 29.7% light trucks, 2.1% large trucks, 17.0% motorcycles, 3.7% other or unknown

Some Pennsylvania lawmakers favor tighter laws governing phones, and at the beginning of 2020, its House passed a . In recent years, the state has to be buckled into a rear-facing car seat and also increased the penalty for texting and driving.

30 / 50
ambrozinio // Shutterstock

#21. North Carolina

- Fatalities per 100 million vehicle miles: 1.19 (-71% change since 1975)
- Total fatalities: 1,437 (-5.0% change since 1975)
- Percent of fatalities related to speeding: 22.8% (#37 highest of all states)
- Percent of fatalities with a driver over .08 BAC: 29.3% (#19 highest of all states)
- Deaths by road user type: 47.0% car, 33.4% light trucks, 2.1% large trucks, 16.0% motorcycles, 1.5% other or unknown

Teenage drivers in North Carolina may and get a limited driver’s license during the COVID-19 pandemic under a bill signed by Gov. Roy Cooper in June 2020. The tests were suspended for health and safety reasons.

31 / 50
4kclips // Shutterstock

#20. Missouri

- Fatalities per 100 million vehicle miles: 1.20 (-65% change since 1975)
- Total fatalities: 921 (-12.0% change since 1975)
- Percent of fatalities related to speeding: 39.8% (#8 highest of all states)
- Percent of fatalities with a driver over .08 BAC: 26.1% (#34 highest of all states)
- Deaths by road user type: 42.6% car, 37.1% light trucks, 3.8% large trucks, 13.8% motorcycles, 2.7% other or unknown

Missouri is one of only three states that doesn’t ban texting by adults while driving. Teenagers are prohibited from texting, however, and .

32 / 50
Canva

#19. Kansas

- Fatalities per 100 million vehicle miles: 1.26 (-62% change since 1975)
- Total fatalities: 404 (-21.0% change since 1975)
- Percent of fatalities related to speeding: 23.3% (#36 highest of all states)
- Percent of fatalities with a driver over .08 BAC: 21.8% (#48 highest of all states)
- Deaths by road user type: 36.8% car, 38.4% light trucks, 5.7% large trucks, 17.3% motorcycles, 1.9% other or unknown

Unlike its neighbor, Kansas banned in 2011 ago, but the state doesn’t have a handheld ban for phone use. Only in the front seat, driver or passenger, buckle up, despite a law requiring seat belt use. That’s below the national average of 86%.

33 / 50
Dawid S Swierczek // Shutterstock

#18. Tennessee

- Fatalities per 100 million vehicle miles: 1.28 (-63% change since 1975)
- Total fatalities: 1,041 (-8.0% change since 1975)
- Percent of fatalities related to speeding: 16.0% (#46 highest of all states)
- Percent of fatalities with a driver over .08 BAC: 23.3% (#44 highest of all states)
- Deaths by road user type: 43.8% car, 32.7% light trucks, 2.6% large trucks, 18.8% motorcycles, 2.1% other or unknown

Last year, Tennessee passed a . Hands-free use is allowed, and fines for violating the law start at $50. Tennessee’s by those in the front seat is just below the national average at 84%.

34 / 50
Philip Lange // Shutterstock

#17. Texas

- Fatalities per 100 million vehicle miles: 1.29 (-68% change since 1975)
- Total fatalities: 3,642 (+8.0% change since 1975)
- Percent of fatalities related to speeding: 27.2% (#28 highest of all states)
- Percent of fatalities with a driver over .08 BAC: 39.5% (#2 highest of all states)
- Deaths by road user type: 38.6% car, 41.4% light trucks, 4.7% large trucks, 14.2% motorcycles, 1.2% other or unknown

Texas’ ban on handheld phone use applies only while in and on public school property. The state has a high rate of seat belt use at 94%.

35 / 50
Charles Knowles // Shutterstock

#16. Idaho

- Fatalities per 100 million vehicle miles: 1.30 (-73% change since 1975)
- Total fatalities: 231 (-18.0% change since 1975)
- Percent of fatalities related to speeding: 19.9% (#42 highest of all states)
- Percent of fatalities with a driver over .08 BAC: 25.1% (#39 highest of all states)
- Deaths by road user type: 34.8% car, 36.2% light trucks, 5.7% large trucks, 18.1% motorcycles, 5.2% other or unknown

Like many other states, Idaho just passed and the ban applies even when stopped at a red light or stop sign. Distracted driving contributed to one of every five crashes in Idaho, according to the Idaho State Police. Texting while driving has been prohibited since 2012.

36 / 50
Andriy Blokhin // Shutterstock

#15. Alabama

- Fatalities per 100 million vehicle miles: 1.34 (-63% change since 1975)
- Total fatalities: 953 (+6.0% change since 1975)
- Percent of fatalities related to speeding: 27.5% (#27 highest of all states)
- Percent of fatalities with a driver over .08 BAC: 25.8% (#37 highest of all states)
- Deaths by road user type: 49.2% car, 36.7% light trucks, 2.8% large trucks, 9.8% motorcycles, 1.5% other or unknown

Alabama passed in 2019 meant to improve road safety. The first is an anti-road-rage law that prohibits drivers from remaining in the left lane for more than a mile-and-a-half without passing. The other two require seat belts in the back seat as well as the front and increase fines for drivers who fail to move over or slow down when passing stopped emergency vehicles.

37 / 50
Canva

#14. South Dakota

- Fatalities per 100 million vehicle miles: 1.34 (-64% change since 1975)
- Total fatalities: 130 (-33.0% change since 1975)
- Percent of fatalities related to speeding: 40.0% (#7 highest of all states)
- Percent of fatalities with a driver over .08 BAC: 34.6% (#5 highest of all states)
- Deaths by road user type: 36.1% car, 42.9% light trucks, 4.2% large trucks, 13.4% motorcycles, 3.4% other or unknown

South Dakota has one of the highest arrest rates for driving while under the influence, with the other top states being neighbors North Dakota and Wyoming. The rankings, presented on the in January 2020, were based on National Highway Traffic Safety Administration statistics on fatal crashes and other data and calculated by .

38 / 50
Keep Smiling Photography // Shutterstock

#13. Oregon

- Fatalities per 100 million vehicle miles: 1.37 (-61% change since 1975)
- Total fatalities: 506 (-10.0% change since 1975)
- Percent of fatalities related to speeding: 21.7% (#40 highest of all states)
- Percent of fatalities with a driver over .08 BAC: 30.2% (#14 highest of all states)
- Deaths by road user type: 34.7% car, 35.2% light trucks, 2.9% large trucks, 18.8% motorcycles, 8.4% other or unknown

Oregon’s steep fine for first-time offenders of its distracted driving law—$1,000—put it at of such laws in the country. , a firm based in New York and New Jersey, analyzed all 50 states’ laws and awarded Oregon the distinction of having the country’s harshest distracted driving law.

39 / 50
Amy Tseng // Shutterstock

#12. Arkansas

- Fatalities per 100 million vehicle miles: 1.41 (-65% change since 1975)
- Total fatalities: 516 (-8.0% change since 1975)
- Percent of fatalities related to speeding: 25.4% (#33 highest of all states)
- Percent of fatalities with a driver over .08 BAC: 26.0% (#36 highest of all states)
- Deaths by road user type: 36.8% car, 40.8% light trucks, 5.8% large trucks, 14.6% motorcycles, 2.0% other or unknown

Arkansas set the for highways at 75 miles per hour if the road is outside a city and has at least four lanes divided by a median. The state is allowing police to stop drivers solely for using a handheld wireless device in a school zone.

40 / 50
Anna Kraynova // Shutterstock

#11. Florida

- Fatalities per 100 million vehicle miles: 1.41 (-56% change since 1975)
- Total fatalities: 3,133 (+57.0% change since 1975)
- Percent of fatalities related to speeding: 9.7% (#49 highest of all states)
- Percent of fatalities with a driver over .08 BAC: 26.0% (#35 highest of all states)
- Deaths by road user type: 44.5% car, 26.2% light trucks, 2.4% large trucks, 25.6% motorcycles, 1.3% other or unknown

Florida , not warnings, to drivers caught texting while driving. Florida had already banned texting by motorists, but police officers could not stop someone solely for texting. Drivers must now use hands-free phones in school and work zones.

41 / 50
MakDill // Shutterstock

#10. Montana

- Fatalities per 100 million vehicle miles: 1.43 (-72% change since 1975)
- Total fatalities: 182 (-37.0% change since 1975)
- Percent of fatalities related to speeding: 36.8% (#11 highest of all states)
- Percent of fatalities with a driver over .08 BAC: 43.4% (#1 highest of all states)
- Deaths by road user type: 26.1% car, 53.9% light trucks, 3.6% large trucks, 12.7% motorcycles, 3.6% other or unknown

Across the country, just over 50% of deaths resulting from vehicle crashes involved only a single vehicle. Montana and led the country at 71%.

42 / 50
Katrina Leigh // Shutterstock

#9. New Mexico

- Fatalities per 100 million vehicle miles: 1.43 (-74% change since 1975)
- Total fatalities: 391 (-30.0% change since 1975)
- Percent of fatalities related to speeding: 33.8% (#14 highest of all states)
- Percent of fatalities with a driver over .08 BAC: 27.6% (#26 highest of all states)
- Deaths by road user type: 36.8% car, 38.2% light trucks, 5.4% large trucks, 15.2% motorcycles, 4.4% other or unknown

New Mexico comes in at sixth place in a recent ranking of the 10 top states with the . A second study in 2019 by Safewise placed the state fourth for . credits the state with the first all-offender interlock law in 2005—interlocks are breathalyzers that can prevent a car from starting.

43 / 50
ambrozinio // Shutterstock

#8. Oklahoma

- Fatalities per 100 million vehicle miles: 1.44 (-57% change since 1975)
- Total fatalities: 655 (-13.0% change since 1975)
- Percent of fatalities related to speeding: 22.4% (#38 highest of all states)
- Percent of fatalities with a driver over .08 BAC: 22.1% (#46 highest of all states)
- Deaths by road user type: 40.1% car, 37.5% light trucks, 5.2% large trucks, 15.9% motorcycles, 1.4% other or unknown

Oklahoma made it in 2015, with a potential penalty of $100. Its ban on handheld phone use applies only to drivers with a learner or intermediate license. Oklahoma’s in the front seat falls just below the national average, 84% versus 86%.

44 / 50
Japan_mark3 // Shutterstock

#7. Alaska

- Fatalities per 100 million vehicle miles: 1.46 (-67% change since 1975)
- Total fatalities: 80 (-29.0% change since 1975)
- Percent of fatalities related to speeding: 52.5% (#1 highest of all states)
- Percent of fatalities with a driver over .08 BAC: 36.3% (#4 highest of all states)
- Deaths by road user type: 23.1% car, 46.2% light trucks, 3.1% large trucks, 18.5% motorcycles, 9.2% other or unknown

Alaska in school zones or on school grounds in 2019, though hands-free use of a phone is allowed. The state comes in ninth on a list of the 10 most dangerous states for DUI deaths, according to

45 / 50
Canva

#6. Kentucky

- Fatalities per 100 million vehicle miles: 1.46 (-58% change since 1975)
- Total fatalities: 724 (-16.0% change since 1975)
- Percent of fatalities related to speeding: 15.3% (#47 highest of all states)
- Percent of fatalities with a driver over .08 BAC: 18.9% (#50 highest of all states)
- Deaths by road user type: 45.1% car, 35.4% light trucks, 2.7% large trucks, 14.9% motorcycles, 1.9% other or unknown

Kentucky is strengthening its DUI laws by to everyone convicted of drunk driving. First-time offenders can choose a lock in exchange for a lighter penalty, but repeat offenders will be required to install one.

46 / 50
Medard L Lefevre // Shutterstock

#5. West Virginia

- Fatalities per 100 million vehicle miles: 1.51 (-65% change since 1975)
- Total fatalities: 294 (-36.0% change since 1975)
- Percent of fatalities related to speeding: 29.9% (#20 highest of all states)
- Percent of fatalities with a driver over .08 BAC: 19.4% (#49 highest of all states)
- Deaths by road user type: 39.2% car, 35.1% light trucks, 4.9% large trucks, 14.7% motorcycles, 6.0% other or unknown

West Virginia is imposing new restrictions on , enforcing a stricter curfew and reducing the number of passengers in a new driver’s car. The of many of the state’s roads contribute to the danger though in 2017 voters approved for improvements.

47 / 50
Andrew Zarivny // Shutterstock

#4. Arizona

- Fatalities per 100 million vehicle miles: 1.53 (-63% change since 1975)
- Total fatalities: 1,010 (+51.0% change since 1975)
- Percent of fatalities related to speeding: 28.2% (#25 highest of all states)
- Percent of fatalities with a driver over .08 BAC: 28.2% (#22 highest of all states)
- Deaths by road user type: 36.6% car, 31.0% light trucks, 2.4% large trucks, 20.1% motorcycles, 9.8% other or unknown

Arizona has and other handheld use of phones, though penalties will not begin until 2021, and local laws can remain in place until next year, when the law takes full effect. A highway that runs through Arizona, Interstate 10, has been designated in the country, according to a study that looked at fatalities between May through September from 2015 to 2017.

48 / 50
Tim Roberts Photography // Shutterstock

#3. Louisiana

- Fatalities per 100 million vehicle miles: 1.53 (-67% change since 1975)
- Total fatalities: 768 (-18.0% change since 1975)
- Percent of fatalities related to speeding: 17.7% (#45 highest of all states)
- Percent of fatalities with a driver over .08 BAC: 28.1% (#23 highest of all states)
- Deaths by road user type: 42.1% car, 39.1% light trucks, 3.0% large trucks, 13.8% motorcycles, 2.1% other or unknown

Some lawmakers in Louisiana have tried to pass while driving. A bill passed the state’s Senatein May but was then defeated by the House over objections to what some saw as an infringement on individual liberties. Louisiana already prohibits texting while driving.

49 / 50
Canva

#2. Mississippi

- Fatalities per 100 million vehicle miles: 1.63 (-57% change since 1975)
- Total fatalities: 664 (+22.0% change since 1975)
- Percent of fatalities related to speeding: 7.2% (#50 highest of all states)
- Percent of fatalities with a driver over .08 BAC: 24.5% (#41 highest of all states)
- Deaths by road user type: 46.0% car, 40.4% light trucks, 3.2% large trucks, 7.2% motorcycles, 3.2% other or unknown

In recent years, Mississippi put a prohibition on riding in the back of a pickup truck, required everyone in a vehicle , and required drivers to use the left lane for passing. The state ranks fifth on a list of the top 10 states with the worst DUI problems, as compiled by using 2018 statistics from the National Highway Traffic Safety Administration as well as arrest and census data.

50 / 50
funnyangel // Shutterstock

#1. South Carolina

- Fatalities per 100 million vehicle miles: 1.83 (-54% change since 1975)
- Total fatalities: 1,037 (+26.0% change since 1975)
- Percent of fatalities related to speeding: 43.1% (#5 highest of all states)
- Percent of fatalities with a driver over .08 BAC: 28.1% (#25 highest of all states)
- Deaths by road user type: 44.1% car, 36.1% light trucks, 2.5% large trucks, 16.7% motorcycles, 0.7% other or unknown

South Carolina is one of seven southern states—the other six are Mississippi, Alabama, Texas, Louisiana, Arkansas, and North Carolina—that rank among the highest for DUI death rates, according to an analysis by . The state includes that is the site of the sixth highest number of crashes of any spot in the United States.

Trending Now