States that most often prescribe opioids to Medicaid patients
This story originally appeared on Ophelia and was produced and distributed in partnership with 麻豆原创 Studio.
States that most often prescribe opioids to Medicaid patients
Almost 20 years after the first wave of opioid overdose deaths in the U.S., more than 75% of drug overdose fatalities were connected to opioid use in 2021, according to the latest data from the Centers for Disease Control and Prevention.
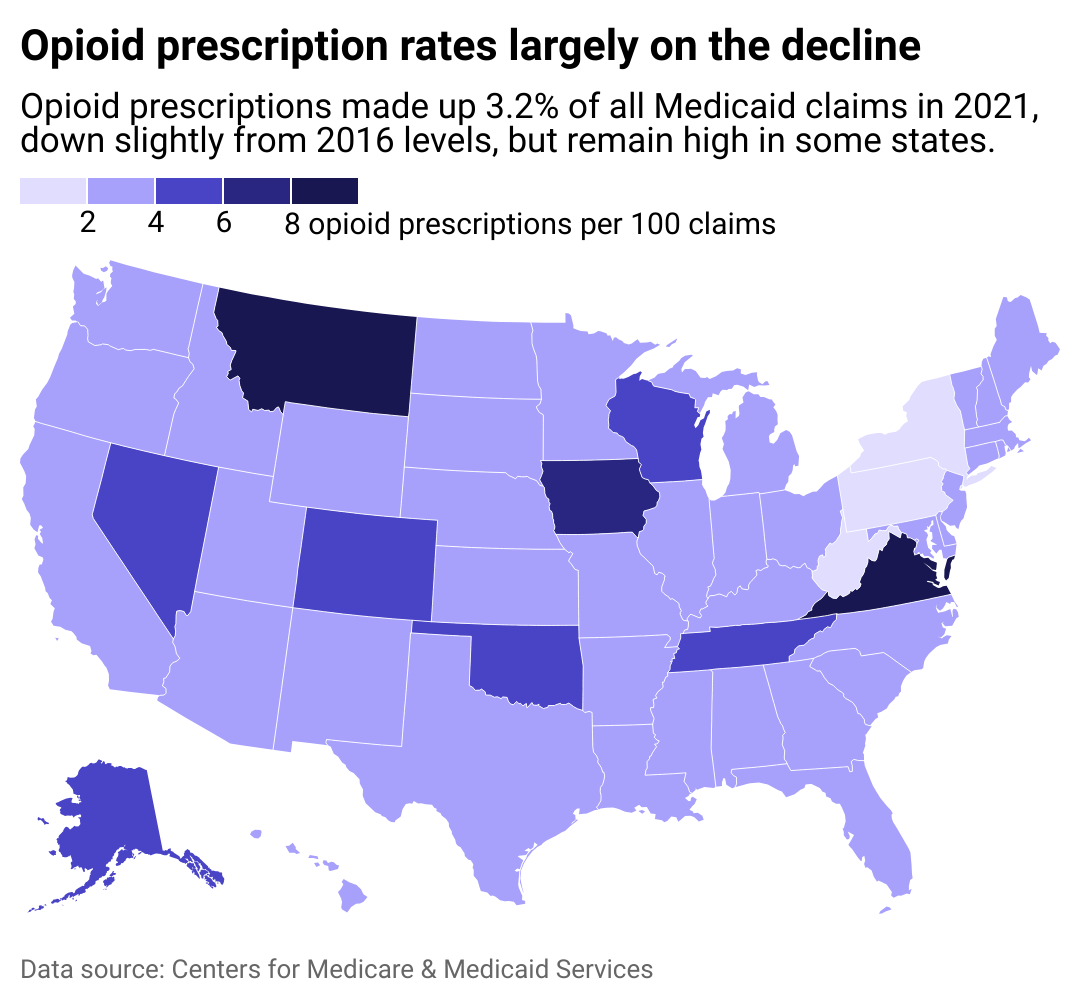
explored how U.S. prescription opioid dispense rates in 2021 varied by state using data, which includes information about Medicaid, a public health insurance coverage for low-income households and people with certain disabilities that is offered jointly by states and the federal government.
According to the, overdose fatalities that involved opioids prescribed for pain management grew more than five-fold from 1999 to 2017, when they peaked at 17,000. Since then, the number of deaths has declined, though there was a slight increase during the COVID-19 pandemic. Within the past decade, policies aimed at controlling the dispensing of legal opioids and promoting alternative nonopioid pain treatments have been credited for slowing the number of prescriptions and overdose deaths.
In 2021, even as most states had implemented laws regulating opioid prescription and freeing access to 鈥攐pioid overdose-reversing medication like Narcan鈥攖he number of fatalities involving prescription opioids totaled 16,700.
Opioids are Schedule II controlled substances, meaning the Drug Enforcement Agency views them as narcotics with "a high potential for abuse which may lead to severe psychological or physical dependence." Though the data included here does not distinguish between the reasons for prescribing, opioids prescribed for addiction treatment鈥攕uch as buprenorphine and methadone鈥攁ctually work to lower the incidence of opioid overdose and lower associated deaths. Furthermore, a found that the COVID-era increase in methadone access for the treatment of opioid use disorder was not associated with an increase in opioid overdose deaths.
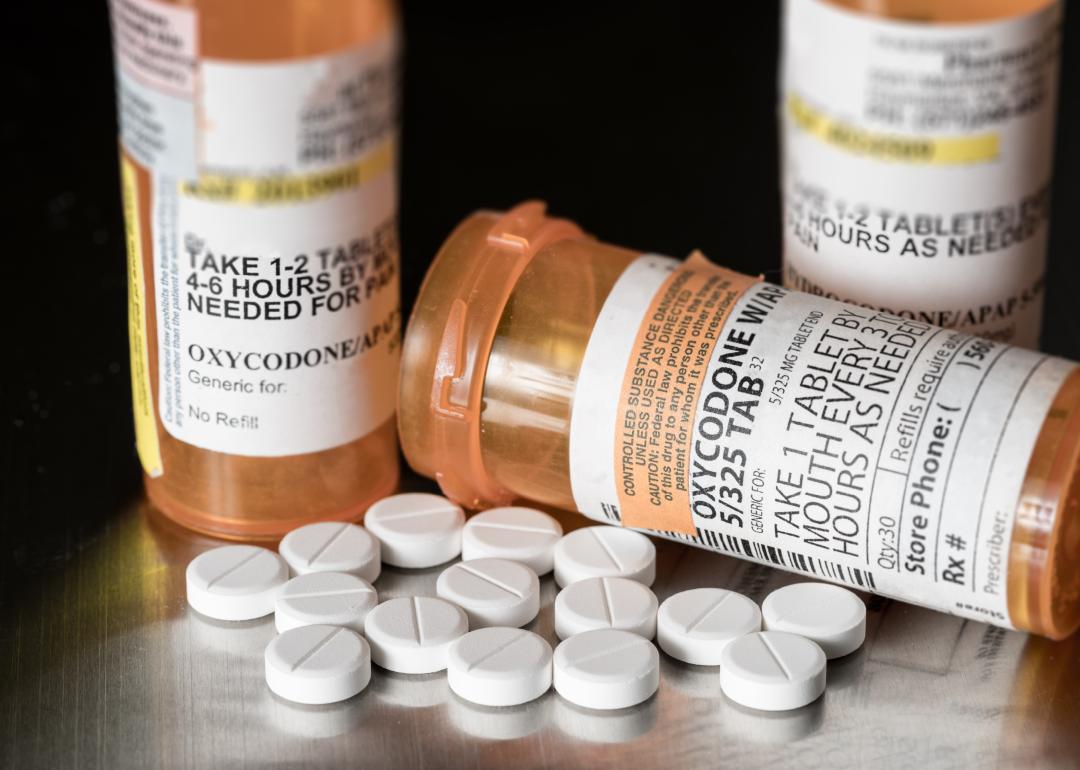
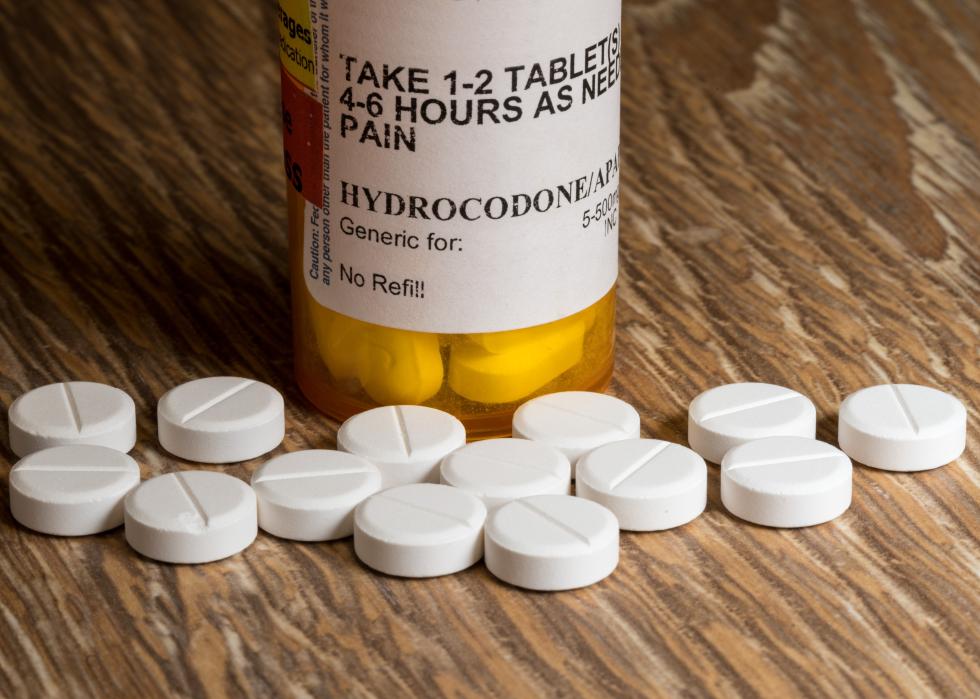
Prescription opioid overdose deaths began increasing in the 1990s when the growing circulation of oxycodone and hydrocodone led to the first wave of extensive opioid drug misuse. By 2016, opioid-related overdose deaths had reached such alarming levels that the health crisis was considered an epidemic. A year later, the U.S. government declared it a public health emergency.
Since then, 27 states passed laws regulating the duration or dosage of first-time opioid-based medication for pain treatments, statutes that resulted in a 2.23% decrease in opioid prescriptions by 2021. However, the introduction of fentanyl in the illegal drug market has delayed the fight against opioid-related overdose deaths. The CDC describes the synthetic opioid as "50 times stronger than heroin and 100 times stronger than morphine."
States with the highest opioid prescribing rates
Montana and Virginia had the highest number of Medicaid opioid prescriptions in 2021, followed by Iowa. Rural counties, in particular, are , according to the Department of Agriculture.
At the other end of the spectrum, New York, Pennsylvania, and West Virginia have the lowest number of Medicaid opioid prescriptions. At one time, West Virginia had the highest rate of overdose deaths in the country and one of the highest prescription rates for opioids. According to a report by the DEA, this can be attributed to the : Workers in these industries often suffer injuries, which physicians mainly treated with opioid pain relievers.
The decrease in opioid prescriptions in West Virginia results from a designed to reduce the use of opioid-based medication after the CDC had reported a "statistically significant increase in drug overdose deaths" in 2015, according to a .
Continue reading to see which states had the highest rates of Medicaid opioid prescriptions in 2021.
#15. Idaho
- Opioid prescribing rate: 3.59
--Change from five years before: -2.53 percentage points
- Total opioid claims: 140,925
#14. Utah
- Opioid prescribing rate: 3.64
--Change from five years before: -3.56 percentage points
- Total opioid claims: 123,197
#13. Oregon
- Opioid prescribing rate: 3.69
--Change from five years before: -3.74 percentage points
- Total opioid claims: 363,484
#12. Hawaii
- Opioid prescribing rate: 3.72
--Change from five years before: -2.44 percentage points
- Total opioid claims: 74,508
#11. Washington
- Opioid prescribing rate: 3.77
--Change from five years before: -3.49 percentage points
- Total opioid claims: 510,784
#10. Wyoming
- Opioid prescribing rate: 3.97
--Change from five years before: -2.44 percentage points
- Total opioid claims: 17,713
#9. Alaska
- Opioid prescribing rate: 4.06
--Change from five years before: -3.84 percentage points
- Total opioid claims: 58,330
#8. Nevada
- Opioid prescribing rate: 4.20
--Change from five years before: -3.95 percentage points
- Total opioid claims: 267,451
#7. Wisconsin
- Opioid prescribing rate: 4.40
--Change from five years before: -3.26 percentage points
- Total opioid claims: 491,604
#6. Colorado
- Opioid prescribing rate: 4.83
--Change from five years before: -4.26 percentage points
- Total opioid claims: 388,714
#5. Tennessee
- Opioid prescribing rate: 4.90
--Change from five years before: -2.15 percentage points
- Total opioid claims: 694,218
#4. Oklahoma
- Opioid prescribing rate: 5.09
--Change from five years before: -2.09 percentage points
- Total opioid claims: 293,862
#3. Iowa
- Opioid prescribing rate: 6.94
--Change from five years before: 2.29 percentage points
- Total opioid claims: 541,375
#2. Montana
- Opioid prescribing rate: 10.41
--Change from five years before: 2.78 percentage points
- Total opioid claims: 310,163
#1. Virginia
- Opioid prescribing rate: 14.49
--Change from five years before: 8.90 percentage points
- Total opioid claims: 2,797,499
Story editing by Jeff Inglis. Copy editing by Kristen Wegrzyn. Photo selection by Clarese Moller.