Most liberal county in states with the highest percentage of conservatives
With the 2024 presidential primaries beginning to ramp up, everyone will soon be talking about "red" and "blue" states. But coloring in an entire state based on the party that tends to prevail there in statewide elections obscures a lot of political diversity. In most states, there are neighborhoods, towns, and counties that hold steadfast against their neighbors and vote for the party that holds an opposing ideology to a majority of the state's residents.
Whether this means those enclaves will see the policy results they want depends on their state's circumstances. In many states, liberal areas are subject to conservative policies that apply to the state at large. In Florida, for instance, Gov. Ron DeSantis has —both of which affect residents of the In Ohio, preemption laws bar cities from regulating certain state-mandated issues, meaning that liberal pockets in Columbus and Toledo are
compiled and statewide to rank states by their share of self-identifying conservatives. Ties were broken by the corresponding percentage of self-identified liberals, as able. Vote data was then used to highlight counties that voted in opposition to the statewide average ideology. (We also looked at conservative strongholds in liberal states.)
Self-described ideology, like Gallup's, is just one way to measure a person or group's politics, of course. Vote choice is another. You could also look at , for example, and your list might look different. In many states in the South, for instance, Black voters are the majority of Democratic voters. And – looking at vote choice – there are pockets of deep blue in otherwise ruby-red states. But Black voters are
Some "battleground" states that split relatively evenly between conservative and liberal didn't make either list. Detailed county voter turnout data was unavailable for Virginia, Alaska, Louisiana, and Alabama. For Washington D.C., ideological data came from a rather than the Gallup data.
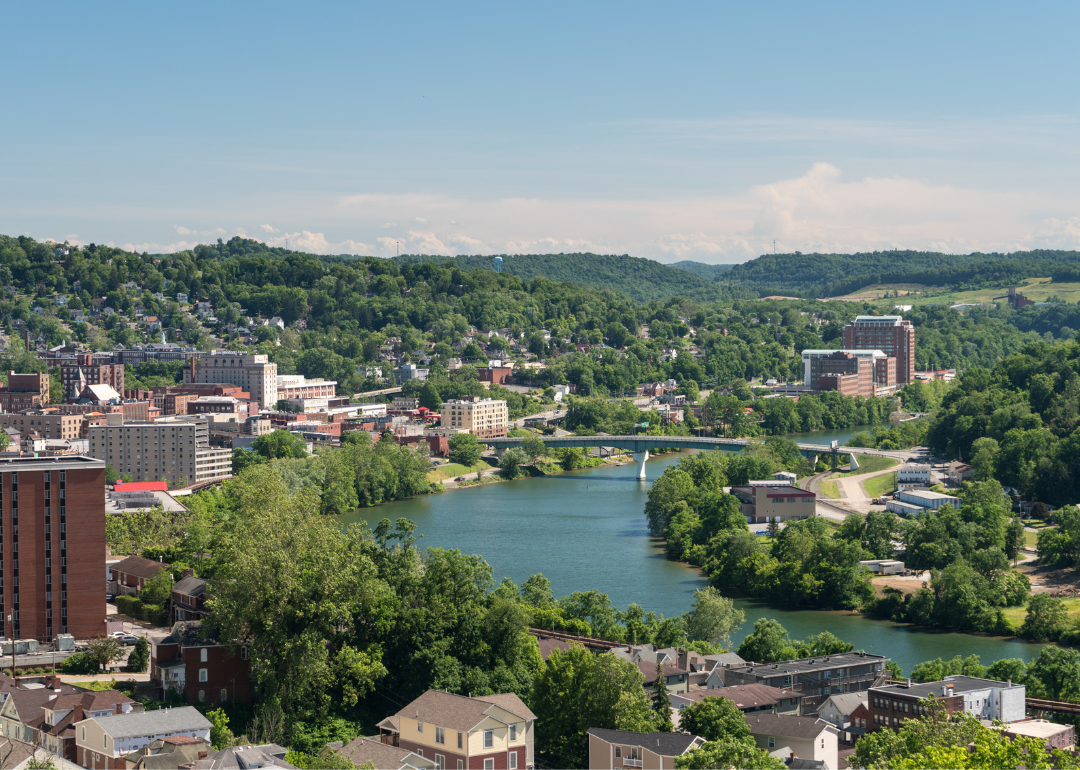
When looking at why an island of liberalism may exist in an otherwise heavily conservative state, there are typically a few reliable tells. Many of the counties included in this list are home to colleges or universities; this means relatively young and well-educated populations, two groups that . The same is true for which are usually home to higher concentrations of communities of color and foreign-born migrants—groups that .
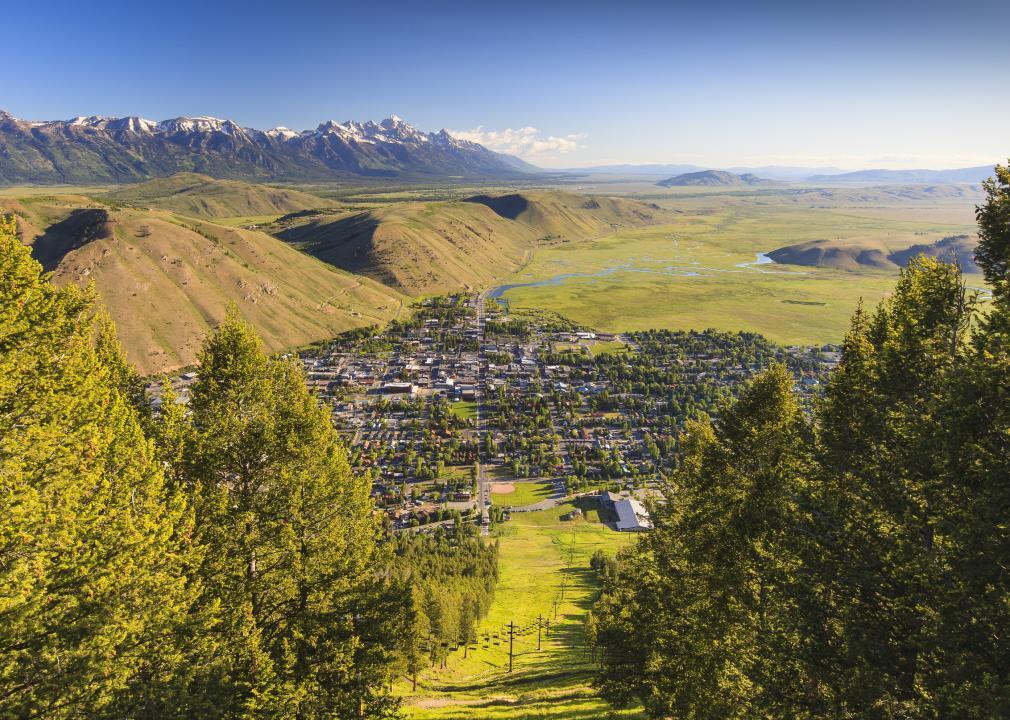
Native American communities and are also often isolated within Republican-majority states; unsurprisingly, this is the case for more than a few counties included here. Even in otherwise conservative areas by attracting mostly upper-class, well-educated transplants as residents.
Read on to discover where liberal strongholds exist in otherwise staunchly conservative states, and what accounts for the unexpected shift from red to blue.
#19. Texas: 20% liberal, 38% conservative (tie)
- Most liberal county: Travis County
--- Democratic votes in 2020: 435,860 (71.4%)
--- Total votes cast: 610,349
Travis County—where the state capital of Austin can be found—represents a larger shift in many Texas counties towards the left, due in large part to a . As of 2022, , and a full third of residents identified as Hispanic or Latino.
#19. New Mexico: 20% liberal, 38% conservative (tie)
- Most liberal county: Taos County
--- Democratic votes in 2020: 13,121 (76.4%)
--- Total votes cast: 17,181
Taos County , resulting in a staunch Democratic leaning. Additionally, the county is home to the University of New Mexico-Taos, providing a concentration of young, well-educated voters that typically results in liberal tendencies.
#18. North Carolina: 21% liberal, 39% conservative
- Most liberal county: Durham County
--- Democratic votes in 2020: 144,364 (80.4%)
--- Total votes cast: 179,594
Durham County's more liberal leaning is possibly due to its large concentration of urban centers and universities. The county holds the cities of Durham and parts of Raleigh, as well as most of the state's most well-known institutes of higher education, including .
#17. Kentucky: 20% liberal, 39% conservative
- Most liberal county: Jefferson County
--- Democratic votes in 2020: 228,272 (59.1%)
--- Total votes cast: 386,061
Jefferson County is the in the state—it is home to more than 780,000 residents, while the next-largest, Fayette County, has less than half that count—and includes Louisville, the state's largest city. Besides a dense population, the county is also home to a heavy concentration of universities and colleges, with .
#16. Georgia: 19% liberal, 39% conservative
- Most liberal county: Clayton County
--- Democratic votes in 2020: 95,476 (85.0%)
--- Total votes cast: 112,344
Clayton County is a particularly diverse area, with . This accounts for its uniquely Democratic leaning; though previously a swing county, the to staunchly liberal.
#13. Kansas: 18% liberal, 39% conservative (tie)
- Most liberal county: Douglas County
--- Democratic votes in 2020: 40,785 (68.6%)
--- Total votes cast: 59,495
Douglas County's blue dominance is owed in large part to encompassing the city of Lawrence, . Lawrence is home to the University of Kansas, which self-describes as Douglas County is particularly young and upper-middle-class: just , and the median household income is $62,594.
#13. Montana: 18% liberal, 39% conservative (tie)
- Most liberal county: Glacier County
--- Democratic votes in 2020: 3,610 (64.3%)
--- Total votes cast: 5,617
Home to the Blackfeet Indian Reservation, Glacier County residents are majority Native American, with . Native American communities tend to lean more liberal than conservative, making this county a , even while surrounded by red-voting counties.
#13. North Dakota: 18% liberal, 39% conservative (tie)
- Most liberal county: Sioux County
--- Democratic votes in 2020: 804 (67.8%)
--- Total votes cast: 1,186
Like Glacier County in Montana, Sioux County's large proportion of Though the tiny area only has .
#12. Indiana: 17% liberal, 39% conservative
- Most liberal county: Marion County
--- Democratic votes in 2020: 247,772 (63.6%)
--- Total votes cast: 389,618
Marion County is home to the state's most populous city, Indianapolis, as well as several universities. This makes the region comparatively urban and young when measured against surrounding central Indiana counties. Additionally, the county is relatively more diverse than nearby majority-white areas, with a
#11. Idaho: 17% liberal, 40% conservative
- Most liberal county: Blaine County
--- Democratic votes in 2020: 8,919 (67.1%)
--- Total votes cast: 13,289
Though not home to the state's most populated cities, Blaine County does have one notable locale that is thought to largely account for its reputation as a Democratic stronghold: . The county is subsequently home to a large number of out-of-staters who choose to live part-time or retire there, and who are usually upper-class, well-educated, and white. 94.4% of Blaine County residents
#10. Missouri: 20% liberal, 41% conservative
- Most liberal county: St. Louis
--- Democratic votes in 2020: 110,089 (82.3%)
--- Total votes cast: 133,793
Home to nearly 1 million residents, St. Louis County (not to be confused with the independent city of St. Louis, ) is diverse, well-educated, urban, and affluent compared to other parts of the state. Only 67.4% of the population is white alone; 25.1% is Black. The . Additionally, the county is home to a large concentration of institutes of higher education, including Washington University in St. Louis, Saint Louis University, and Maryville University.
#9. South Carolina: 16% liberal, 41% conservative
- Most liberal county: Allendale County
--- Democratic votes in 2020: 2,714 (75.7%)
--- Total votes cast: 3,585
Though Allendale is the , it is also one of the most politically active. Though these superlatives would usually tilt a county towards conservatism, Allendale County is also, and the region's lack of dependable health care, employment, and transportation has led to widespread support for Democratic initiatives like Medicaid.
#7. Arkansas: 15% liberal, 41% conservative (tie)
- Most liberal county: Pulaski County
--- Democratic votes in 2020: 101,947 (60.0%)
--- Total votes cast: 169,956
The most populous county in the state and home to the capital city of Little Rock, Pulaski County is relatively diverse and young. Only .
#7. Utah: 15% liberal, 41% conservative (tie)
- Most liberal county: Summit County
--- Democratic votes in 2020: 15,244 (58.0%)
--- Total votes cast: 26,289
Summit County is the most liberal area in the state thanks mostly to the urban center of Park City, which of the county's . While Park City is other areas within the county itself lean more conservative. In the ski resort town of Park City, however, upper-class, well-educated residents have huge sway. With an average income of $91,470,
#6. Oklahoma: 18% liberal, 43% conservative
- Most liberal county: Cleveland County
--- Democratic votes in 2020: 49,827 (41.6%)
--- Total votes cast: 119,778
Cleveland County's as the bluest county in the state. The county is part of the state's largest metro area (Oklahoma City) and the state's largest university (the University of Oklahoma). Additionally, the county is (34.98% of adults have bachelor's degrees or higher) and younger (the median age is 37.3) than surrounding areas, which both correlate with higher populations of liberals.
#5. Tennessee: 17% liberal, 43% conservative
- Most liberal county: Shelby County
--- Democratic votes in 2020: 246,105 (64.4%)
--- Total votes cast: 382,055
Shelby County has three standout qualities that place it squarely in the blue. First, it is home to a large urban center (Memphis, with a population of over 600,000). Secondly, its population is majority Black, accounting for . Finally, it contains a large concentration of colleges and universities, including the University of Memphis, Rhodes College, Remington College, and the University of Tennessee Health Sciences Center.
#4. South Dakota: 13% liberal, 44% conservative
- Most liberal county: Oglala Lakota County
--- Democratic votes in 2020: 2,829 (88.4%)
--- Total votes cast: 3,200
Like , Oglala Lakota is a Democratic stronghold in a Republican state (much like Glacier County, Montana, and Sioux County, North Dakota). , which is unsurprising considering the entire county sits .
#3. West Virginia: 17% liberal, 45% conservative
- Most liberal county: Monongalia County
--- Democratic votes in 2020: 20,282 (48.2%)
--- Total votes cast: 42,072
Monongalia County is home to Morgantown, a city that is —and consequently, starkly liberal as well. Like many other college towns, Morgantown—home to West Virginia University—is than more rural areas.
#2. Wyoming: 18% liberal, 46% conservative
- Most liberal county: Teton County
--- Democratic votes in 2020: 9,848 (67.1%)
--- Total votes cast: 14,677
While Wyoming writ large is rural and agricultural, Teton County—which contains the Jackson ski resort—is a . Like Park City, Utah, and Blaine County, Idaho, ski towns come with wealth, and with wealth comes Democrats: the .
#1. Mississippi: 12% liberal, 50% conservative
- Most liberal county: Jefferson County
--- Democratic votes in 2020: 3,327 (86.1%)
--- Total votes cast: 3,863
Though , Jefferson County is also diverse. , accounting for the region's liberal character.
Data reporting by Sam Larson. Story editing by Brian Budzynski. Copy editing by Tim Bruns.