Aging homes, rising prices: The 10 cities with the oldest houses in the U.S.
Aging homes, rising prices: The 10 cities with the oldest houses in the U.S.
The oldest cities have the oldest homes — and too little new construction.
Some people love old homes. Exposed brick, original hardwood floors, and a sense of history can instantly win buyers over. However, behind the appeal lies a growing issue: America’s housing stock is aging fast, and new construction isn’t keeping up.
In 2012, the typical U.S. home was 35 years old; today, it’s 41. A in new construction brought on by the Great Recession has accelerated the aging process. Just 9% of the nation’s homes were built in the 2010s, compared to 11% that were built before 1940.
Years of underbuilding have pushed the U.S. housing shortage , which is a behind today’s . Prices have steadily risen for years, even as elevated mortgage rates and economic uncertainty .
However, not every region is aging at the same rate. In Sun Belt cities like Austin, more than 20% of homes were built in the 2010s, compared to just 4% in Midwest cities like Milwaukee. These differences have shaped . Sun Belt cities are seeing prices drop due to an inventory surplus, while Midwest cities are as buyers fight over dwindling supply.
So, where is new construction needed most? ranks the 10 U.S. cities with the oldest homes and explores how aging housing impacts today's housing market.
The cities with the oldest houses in the U.S.
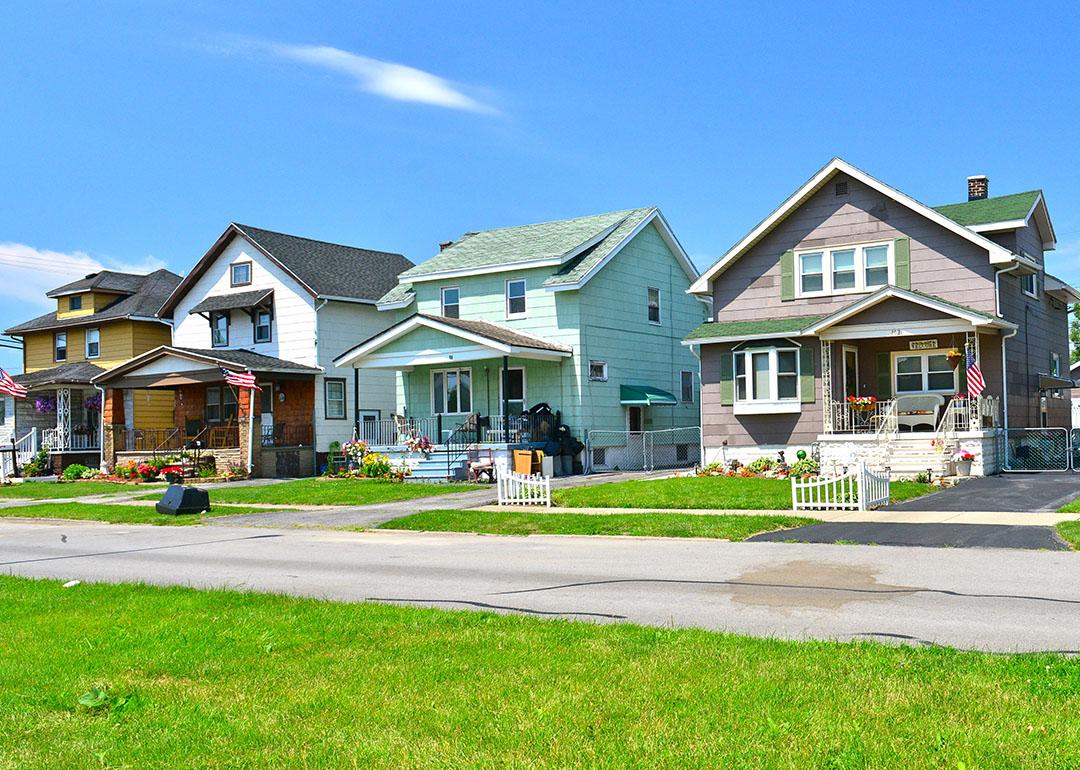
1. Buffalo, NY
- Median housing age: 66 years
- Share of sold homes <5 years old: 2.6%
- Share of sold homes >30 years old: 87.3%
Buffalo has the oldest houses in the country, with the typical home built in 1957. In fact, more than 24% of the city’s housing predates 1940, giving many neighborhoods a historic feel. Brick facades, original woodwork, and wide front porches .
But Buffalo’s aging homes also highlight a bigger trend: very little new construction. Just 1% of homes were built after 2020, and less than 3% of recently sold homes are under five years old. High building costs and have to add new housing, and many older homes are .
With so few new homes, buyers pay a premium for anything built recently. Homes built within the past five years sell for more than twice as much as homes over 30 years old ($527,500 vs. $249,000).
2. New York, NY
- Median housing age: 63 years
- Share of sold homes <5 years old: 5%
- Share of sold homes >30 years old: 80%
lies in its : pre-war walk-ups, iconic brownstones, and high-rises that have shaped the skyline for generations. More than half of the city’s housing was built before 1960, giving it an unmistakable appeal that’s hard to find in newer cities.
However, New York’s allure brings with it . This unaffordability can be traced to a rapidly aging housing supply and a over the past few decades. Just 0.1% of homes were built after 2020.
Homebuilding with demand high construction costs and restrictive zoning laws. As a result, prices remain high and affordable housing remains for many, even as the city works to and zoning codes.
3. Springfield, MA
- Median housing age: 63 years
- Share of sold homes <5 years old: 3.4%
- Share of sold homes >30 years old: 84.3%
Springfield is a New England city its colonial buildings and role in the Revolutionary War. Historic homes — especially Victorian-style houses — are a hallmark of the region. The city its character and even provides grants to help homeowners restore original architectural details.
Because Springfield is more than 300 years old, it’s not surprising that it has some of the oldest houses in the country. 50% of the city’s homes were built prior to 1960, and 84% of the sold housing stock is more than 30 years old.
Springfield was in the country in 2024, but unfortunately, there to go around. This shortage has pushed house prices up by 39% since 2020, as buyers fight over a limited supply.
4. Pittsburgh, PA
- Median housing age: 62 years
- Share of sold homes <5 years old: 4.5%
- Share of sold homes >30 years old: 81.2%
An industrial hub turned modern mecca, Pittsburgh is one of the — and for good reason. A revitalized downtown, very affordable housing, and into its future has turned “Steel City” into a great place to call home.
However, housing here is aging fast. Over 80% of recently sold homes are more than 30 years old, and most were built before 1960. Many people love their , but there aren’t enough to go around. Demand is now outpacing supply, 27% since the pandemic and creating one of the hottest markets in the nation.
To tackle the shortage, Pittsburgh vacant downtown offices into affordable housing. With Pennsylvania needing new homes by 2040 and buyers increasingly targeting the Midwest and Northeast, the state needs to its building efforts.
5. Scranton, PA
- Median housing age: 62 years
- Share of sold homes <5 years old: 4.1%
- Share of sold homes >30 years old: 79.2%
Scranton is a city in the midst of a . Some newcomers are drawn to its walkable neighborhoods and classic Victorian architecture, which gives parts of the city a Colonial-era charm. Others see it as an affordable place to start a business or build a new life.
But while Scranton has a growing appeal, the housing stock tells a different story. The typical house was built in 1961, nearly a third of all homes were built prior to 1940, and less than 1% have been built since 2020.
Years of and population decline have left the industrial city with an aging, housing stock that’s increasingly unaffordable to maintain or replace. With more people now looking to move in, Scranton house prices . Newer houses come at a nearly $200,000 premium, too.
6. New Haven, CT
- Median housing age: 61 years
- Share of sold homes <5 years old: 3.7%
- Share of sold homes >30 years old: 84.9%
New Haven’s character is easy to spot, with its Colonial-era architecture and charming neighborhoods filled with older homes. The region’s history even includes the (1639) in nearby , one of the oldest buildings in the country.
That history shows up in the data, too. Roughly 85% of recently sold homes in New Haven were built more than 30 years ago, with the majority dating back to 1970. Just 0.5% of the area’s housing stock has been built since 2020.
This lack of new construction has helped drive up prices and contributed to a higher . of locals are cost burdened, and residents lose housing every year. The city has responded by into improving its affordable housing program.
Connecticut also isn’t seeing the relief that other places are, with fewer homeowners listing their properties. In April 2025, New Haven and nearby Concord had the fewest new listings among major U.S. cities, making it harder for buyers to find available homes.
7. Boston, MA
- Median housing age: 60 years
- Share of sold homes <5 years old: 10.4%
- Share of sold homes >30 years old: 72.4%
Boston is a New England icon its cobblestone streets and world-class universities. dot its narrow alleys and countryside, like the 300+ year old Paul Revere House and 18th-century Long Wharf.
People love Boston and its historic homes, but unfortunately, they’re . The typical house costs $750,000, while placed the city as the fifth-most expensive place to live in the world. The behind high prices? Too little, too old housing supply. The typical Boston house was built in 1963, while a quarter were built pre-1940.
To meet current and future demand, Boston needs an additional 128,000 housing units by 2030. However, construction has slowed since the pandemic, in part due to .
8. Cleveland, OH
- Median housing age: 59 years
- Share of sold homes <5 years old: 4%
- Share of sold homes >30 years old: 80.5%
Cleveland is one of the Rust Belt’s most prominent . From the redevelopment of the Flats to , the city is steadily transforming into a modern hub without losing sight of its industrial roots.
However, housing construction hasn’t kept the same pace. A quarter of Cleveland’s homes were built before 1950, and just 1% of the city’s housing stock has been built since 2020 — mostly in the form of new . As a result, housing is getting more expensive.
To address the shortage, the city is . One proposal to spur development includes to fill the city’s 18,000 vacant lots with new homes.
9. Bridgeport, CT
- Median housing age: 58 years
- Share of sold homes <5 years old: 3.8%
- Share of sold homes >30 years old: 81.3%
Twenty minutes southwest of New Haven, Bridgeport is a coastal city its sweeping Long Island views and . After decades of decline, it’s been gradually , drawing new residents with its affordability and historic charm.
Bridgeport is also one of the oldest cities in the U.S. First settled in 1639, it’s dotted with lovable historic homes — like the , built in 1680. The typical home in Bridgeport was built in 1965, with a quarter built prior to 1950.
But housing remains tight. 39% since 2020, and new construction has slowed, making it harder for buyers to find available homes. Connecticut actually has the of available housing (including rentals) in the nation: Just 7% of homes are vacant, well below the national rate of 11%.
10. Los Angeles, CA
- Median housing age: 57 years
- Share of sold homes <5 years old: 4.9%
- Share of sold homes >30 years old: 80.1%
Los Angeles is sprawling, , and architecturally influential, home to like the . While it’s one of the older West Coast cities, it was still founded over 100 years after many cities on this list. Places like Boston were by the 19th century, while L.A.’s major growth occurred in the .
It may be surprising to learn that such a modern city has some of the oldest housing in the country — but it’s true. The typical house was built in 1966, and more than half of the city’s homes were built between 1950-1980. Neighborhoods are full of mid-century and .
New construction has slowed significantly in recent years, largely zoning laws and skyrocketing costs. of L.A.’s residential land is zoned for single-family housing. The city is working on a major rezoning plan, but it won’t spur enough development to meet housing needs.
The 10 cities with the newest houses in the U.S.
Cities in the Sun Belt and Mountain West have built the most new housing since 2010 to keep up with an . This has brought their median housing age down.
- Austin, TX: 20 years
- Provo, UT: 20 years
- Raleigh, NC: 22 years
- Cape Coral, FL: 23 years
- Las Vegas, NV: 23 years
- McAllen, TX: 23 years
- Boise, ID: 24 years
- Charleston, SC: 24 years
- Houston, TX: 25 years
- Charlotte, NC: 25 years
How has underbuilding affected the housing market?
Underbuilding has helped create a housing market that is both slow and expensive. With too few homes to meet demand, buyers who haven’t been priced out are forced to compete over limited inventory, driving prices even higher. This is especially true in the nation’s oldest cities and industrial hubs.
Another result of underbuilding is a shrinking price gap between new and existing homes. There are a few reasons for this:
- Home builders are building smaller and lower-cost homes, like townhouses, pushing down the median price of all newly built homes.
- Much of the new construction is happening in historically affordable regions like the Sun Belt, where home prices are starting to fall as supply catches up with demand.
- Homebuyers are flocking to metros with the oldest homes, like Buffalo, helping push prices up.
, this disparity can be so strong that new homes cost less than old ones. Homes built more than 30 years ago in Austin, Oxnard, San Jose, and San Francisco cost more than a home built in the past five years.
Methodology
Based on an original , which analyzed the median age of housing sold nationally and for the 100 largest U.S. metropolitan areas (“cities”). For this report, we used U.S. Census Bureau data to calculate the true median age of all housing — not just homes that sold — through 2023.
All other housing data — i.e. share of homes <5 or >30 years old, and median price of older and newer homes — came from the MLS and measured sold homes from 2020 to 2024.
All datasets refer to all home types combined (single family, condos, and townhouses). Housing market data came from Redfin.
was produced by and reviewed and distributed by Â鶹Դ´.


