Cities with the most expensive homes in Texas
Purchasing a home is one of the most important investments there is. More than a place to live, homeownership is an asset with the potential to tremendously rise in value. But with home prices reaching record heights, plays a huge role for buyers.
The typical home value in the United States was $359,078 in December, 0.1% higher than the year before.
High mortgage rates are also making monthly payments more expensive; as of January 15, the sits at 6.06%.
Although home prices have inflated all across the U.S., there are some cities that command a higher price tag than others. Location, size, age, and condition are all contributing factors to home value.
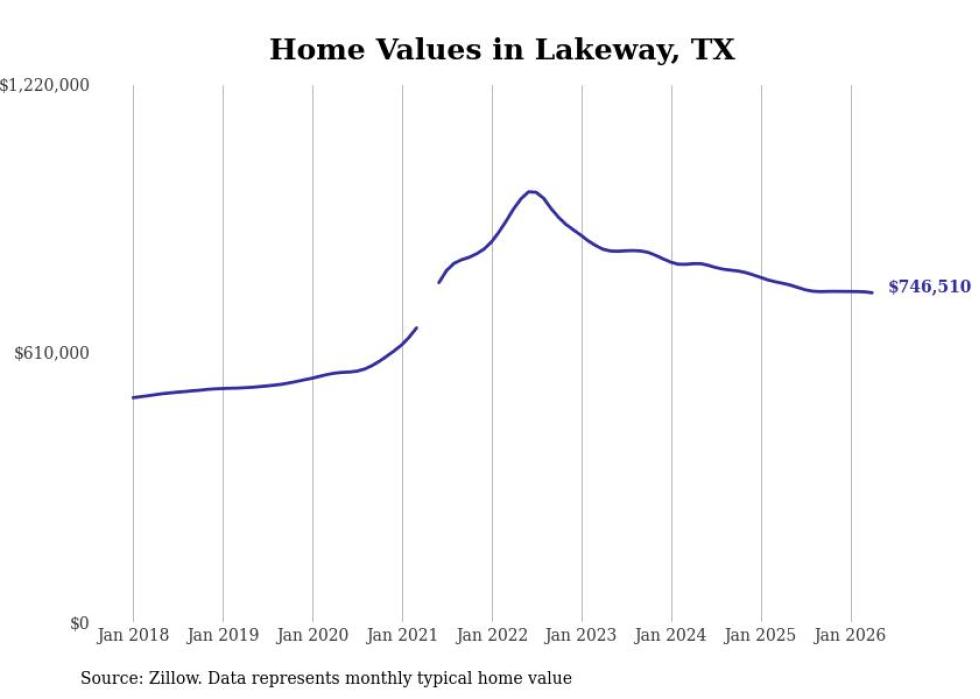
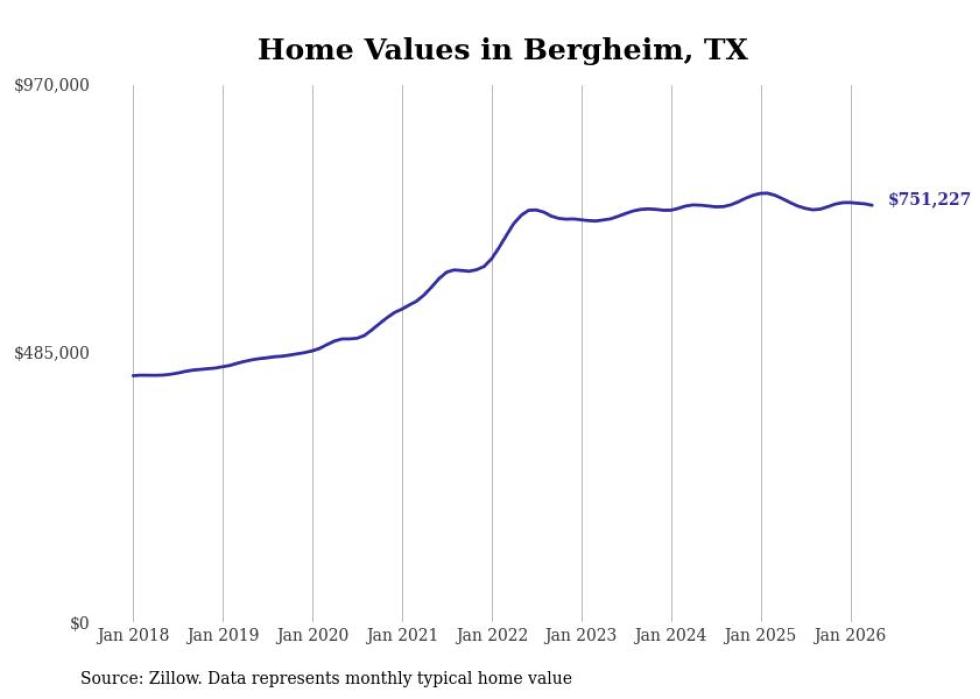
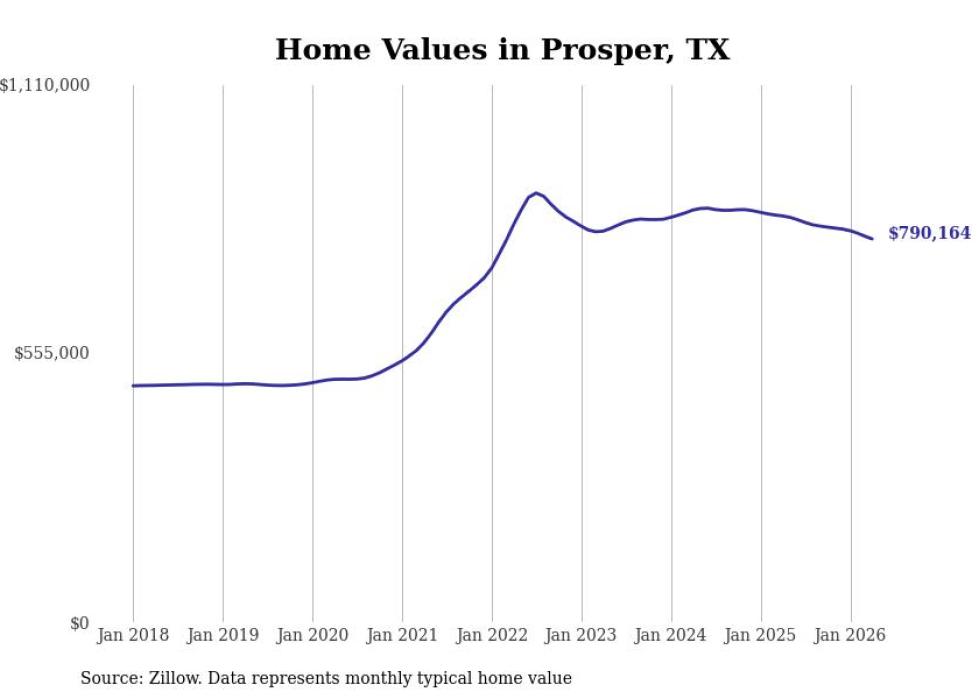
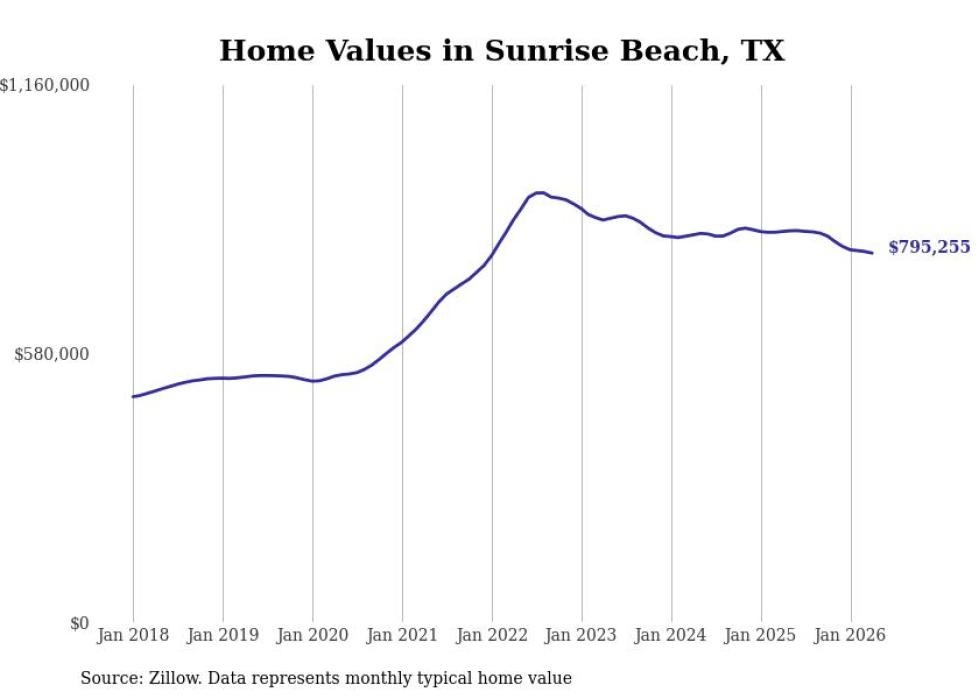
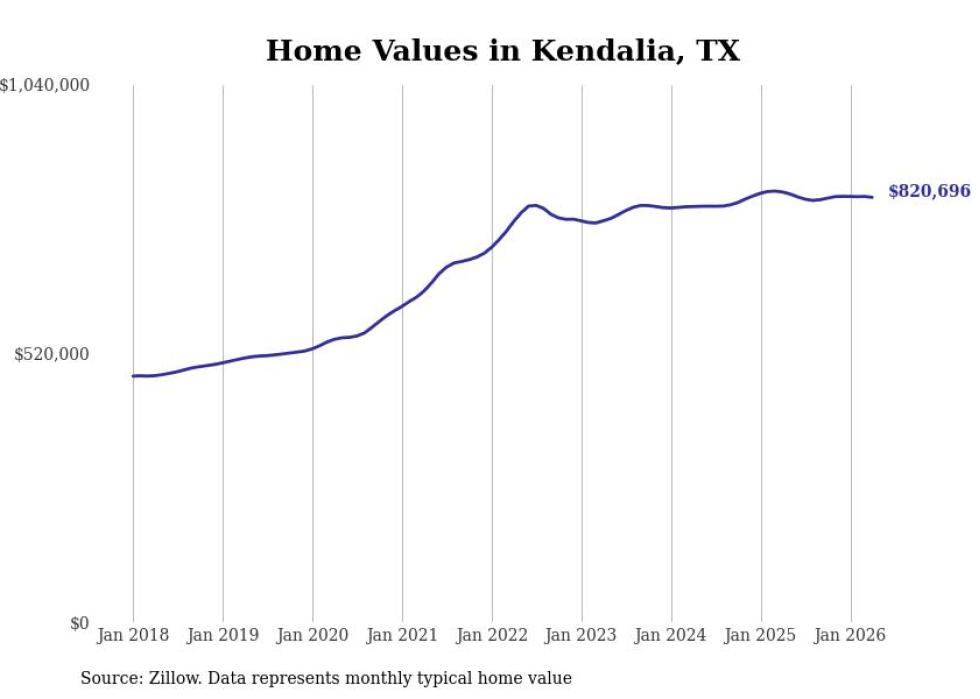
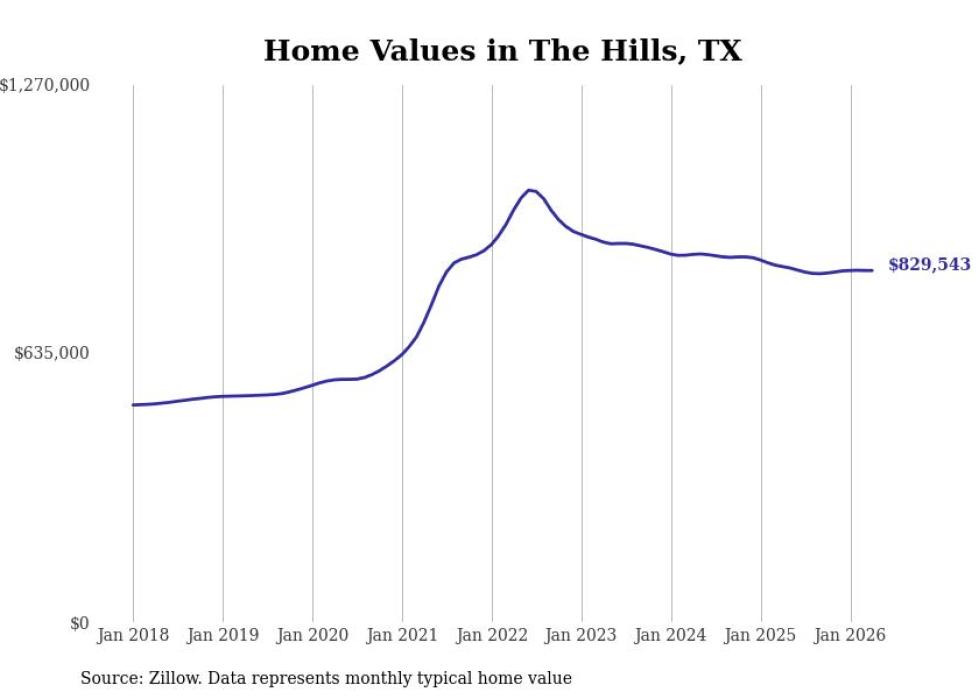
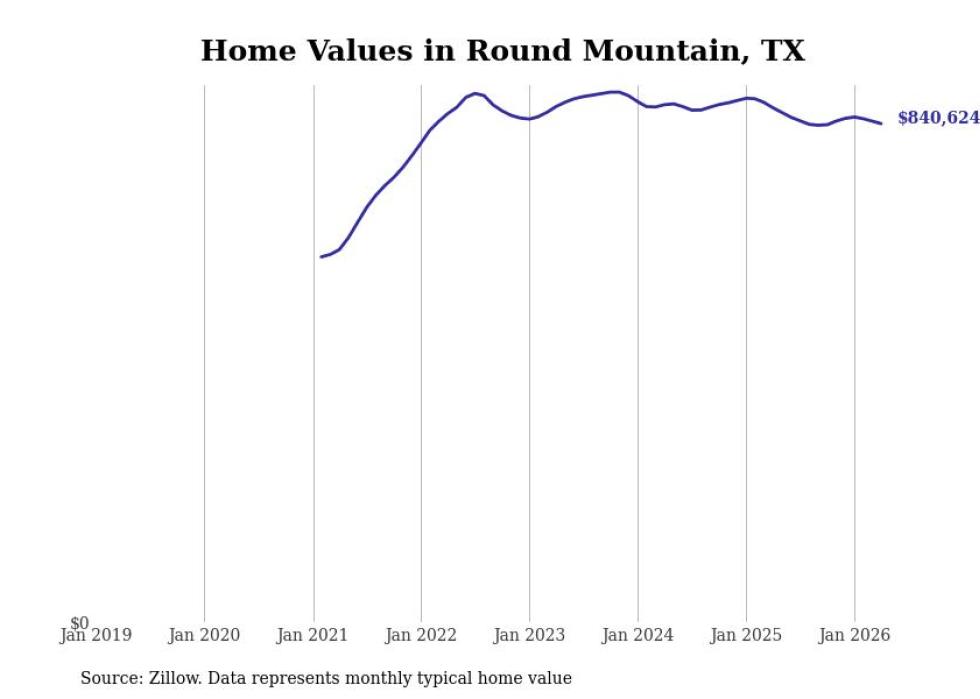
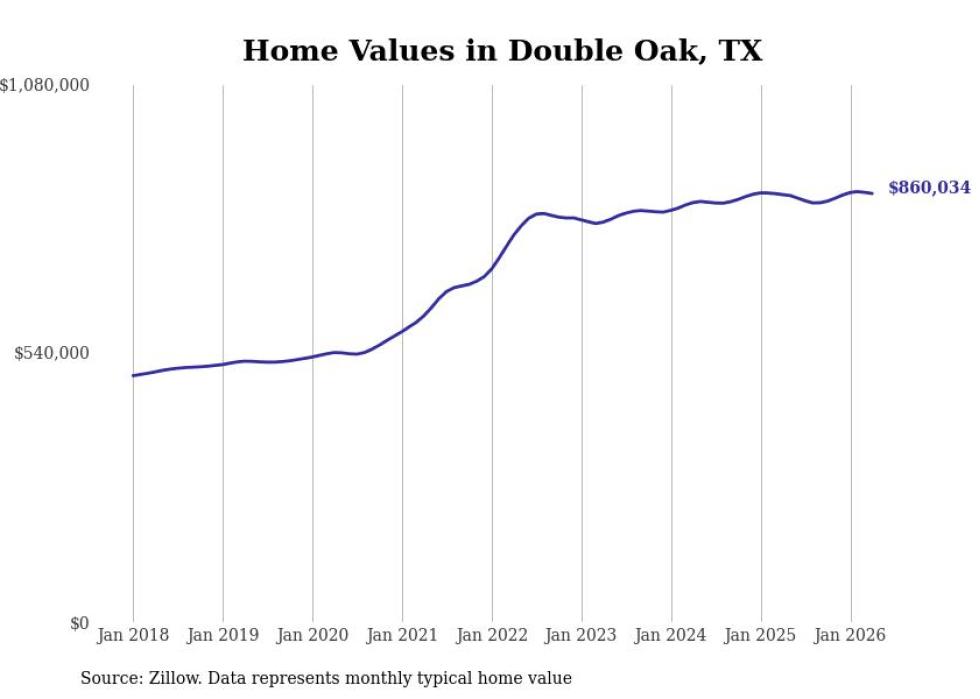
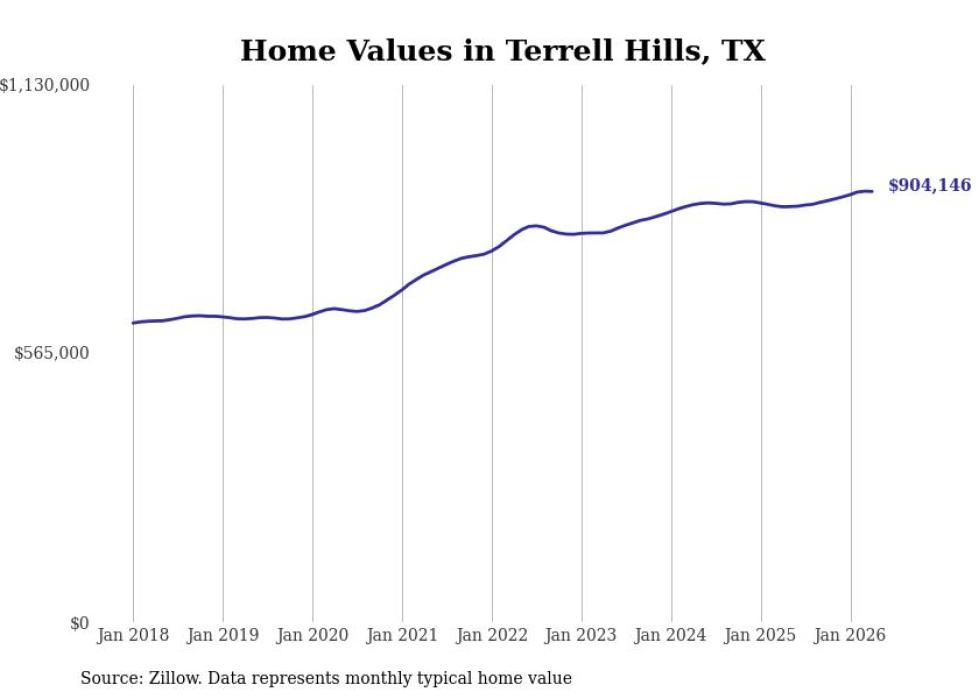
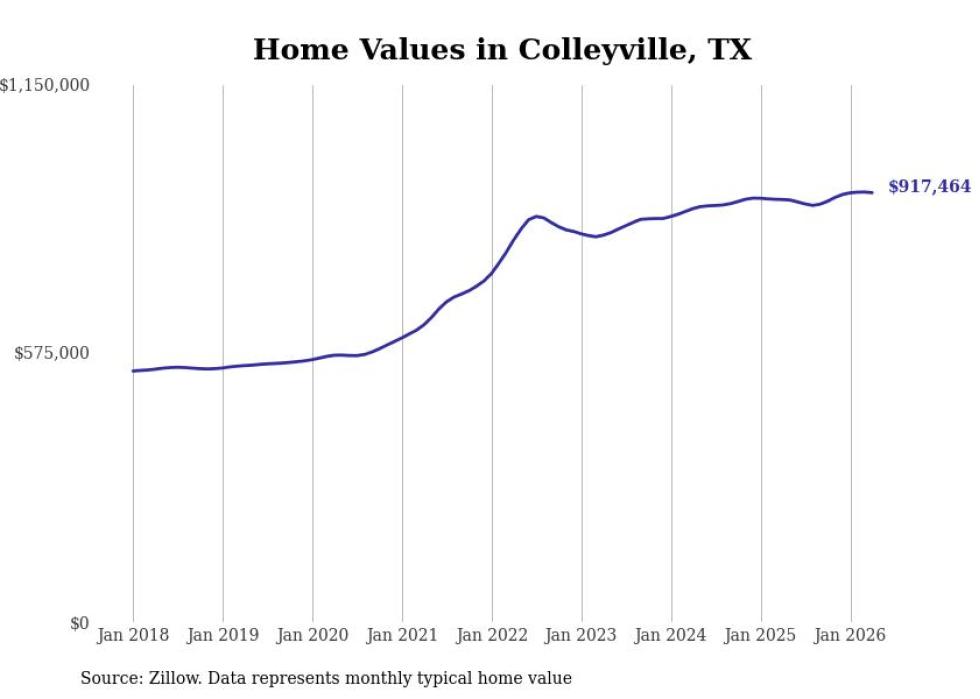
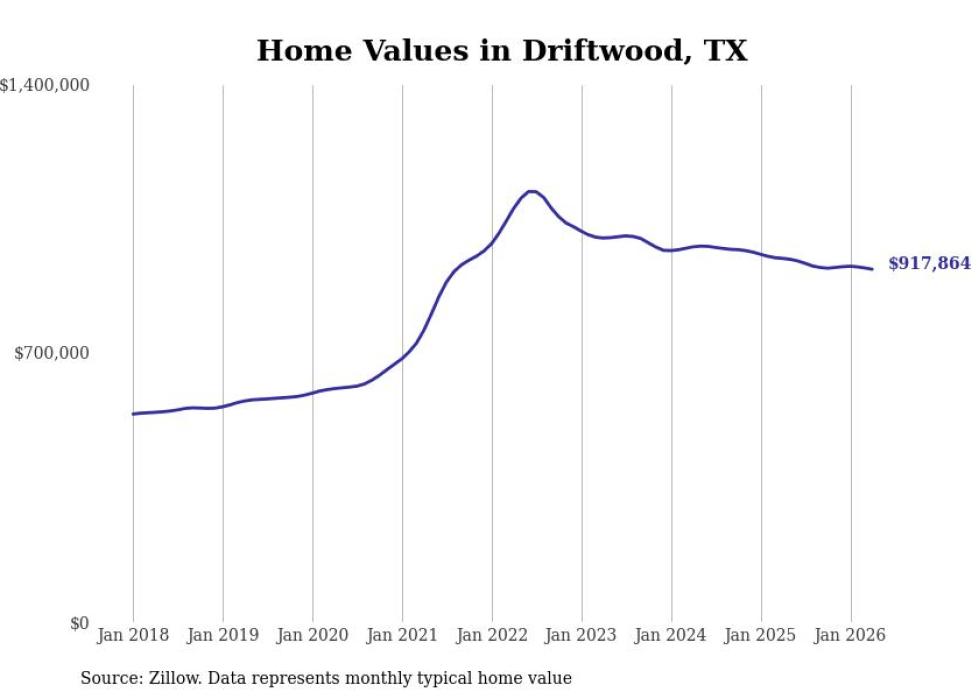
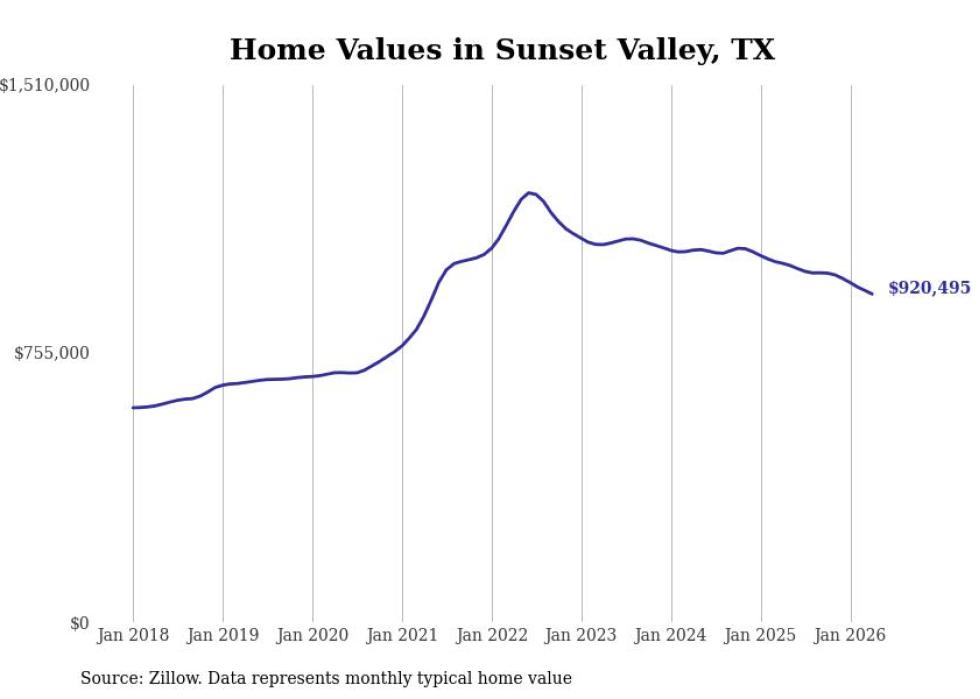
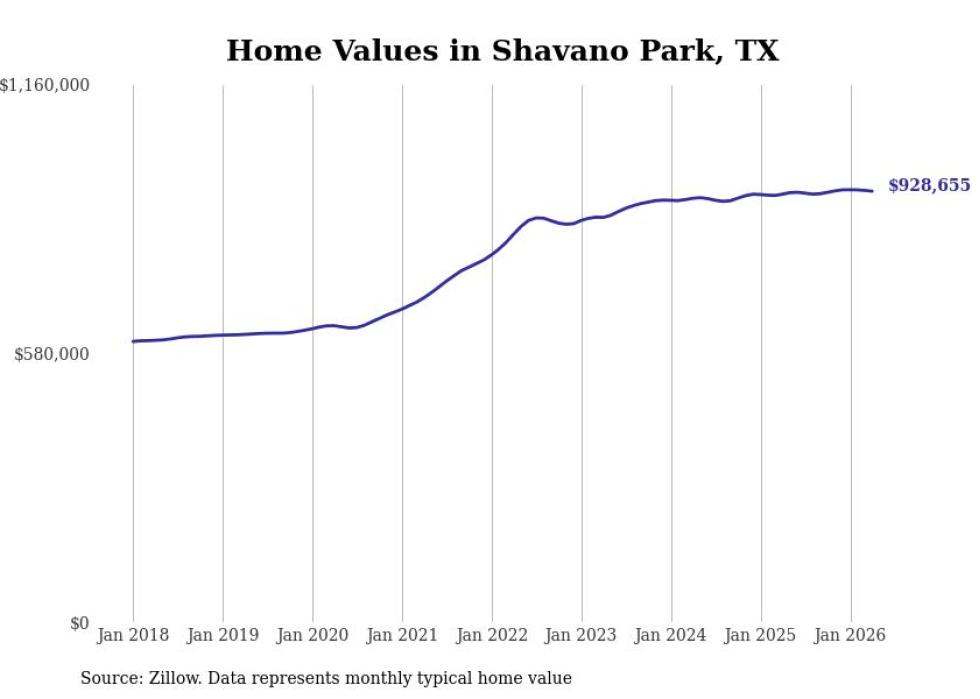
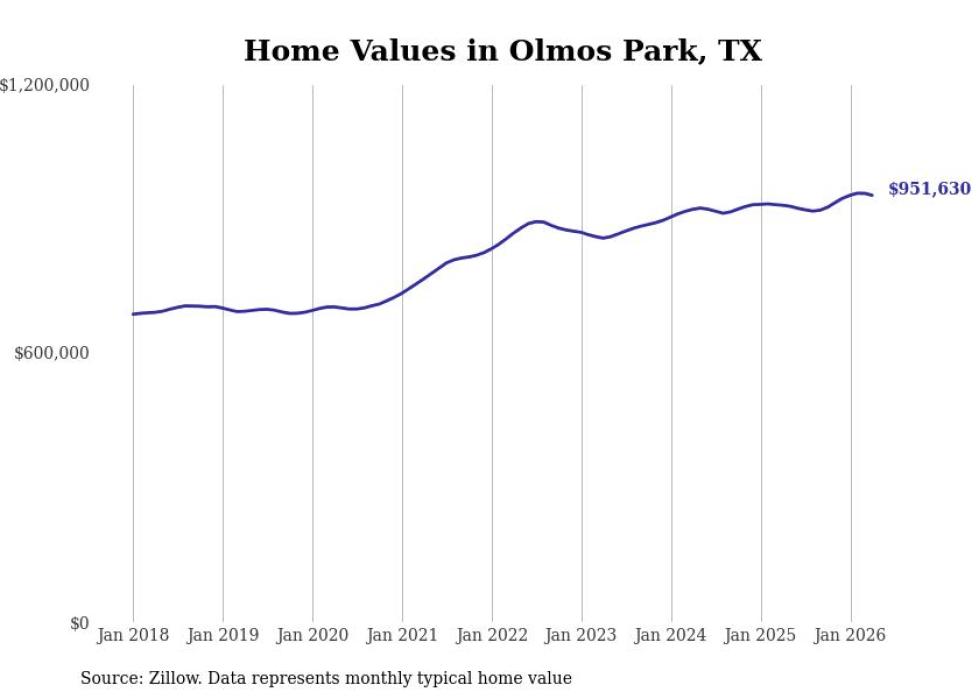
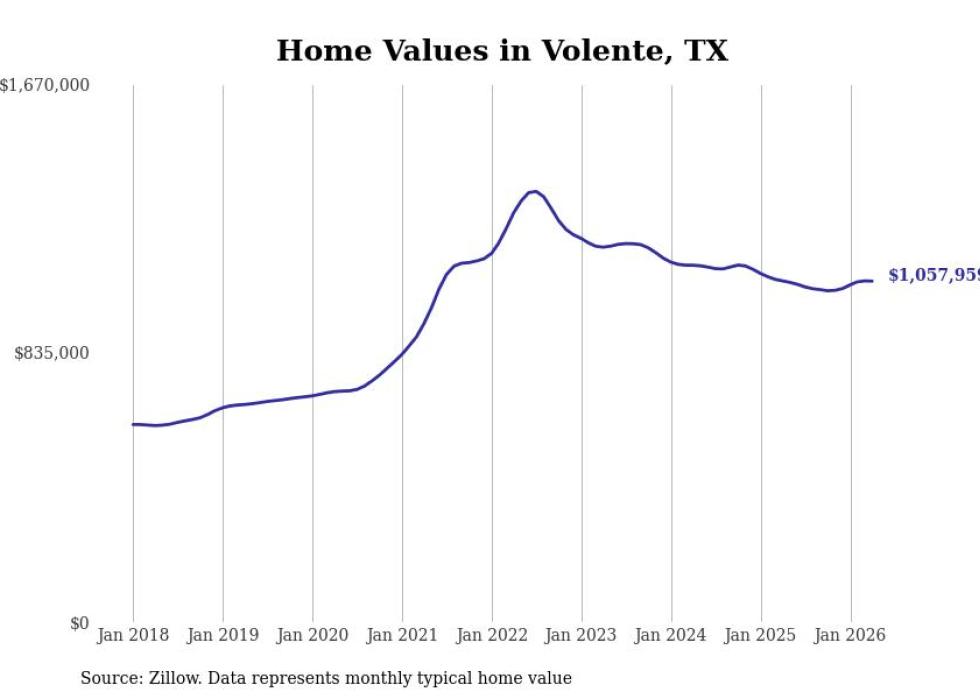
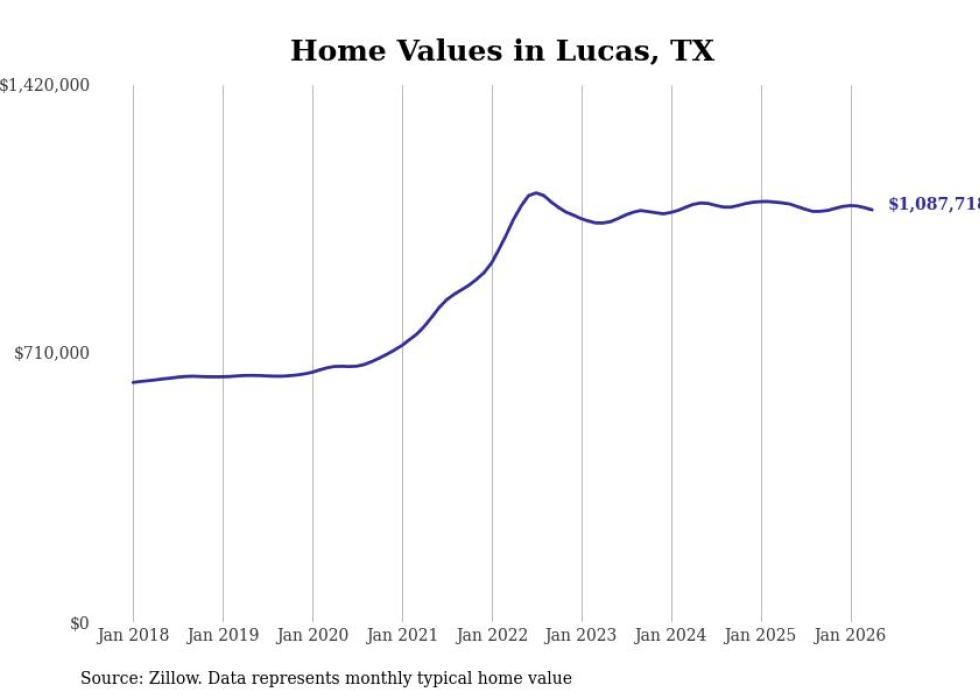
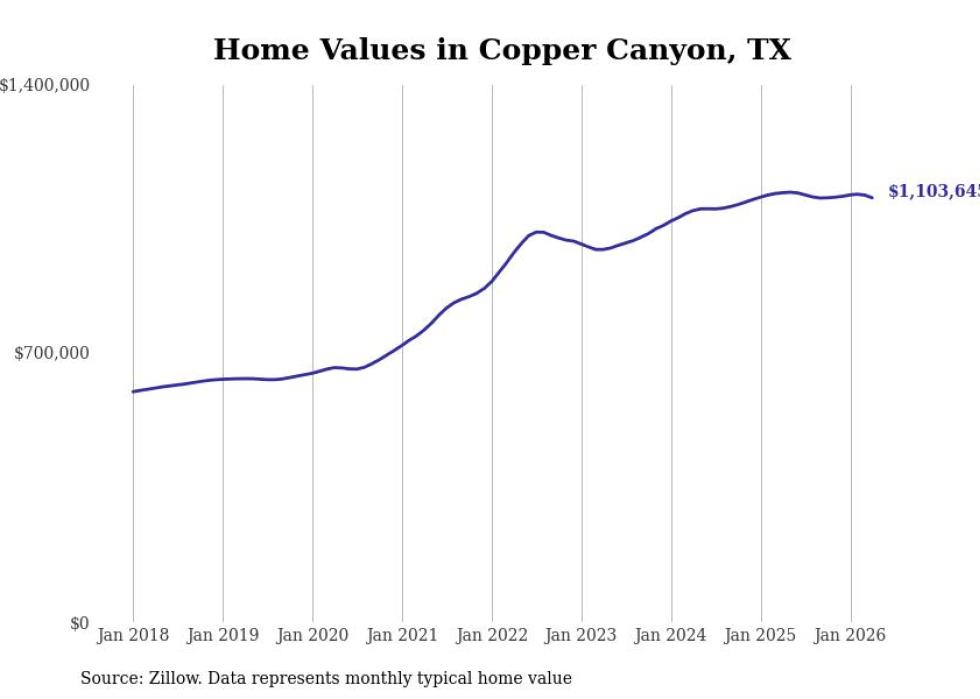
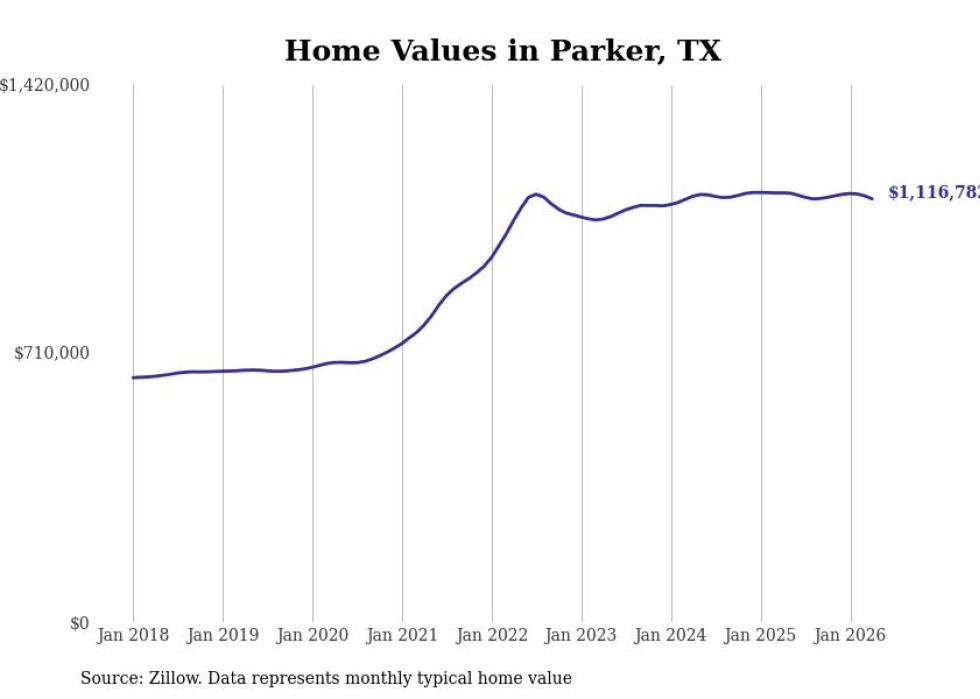
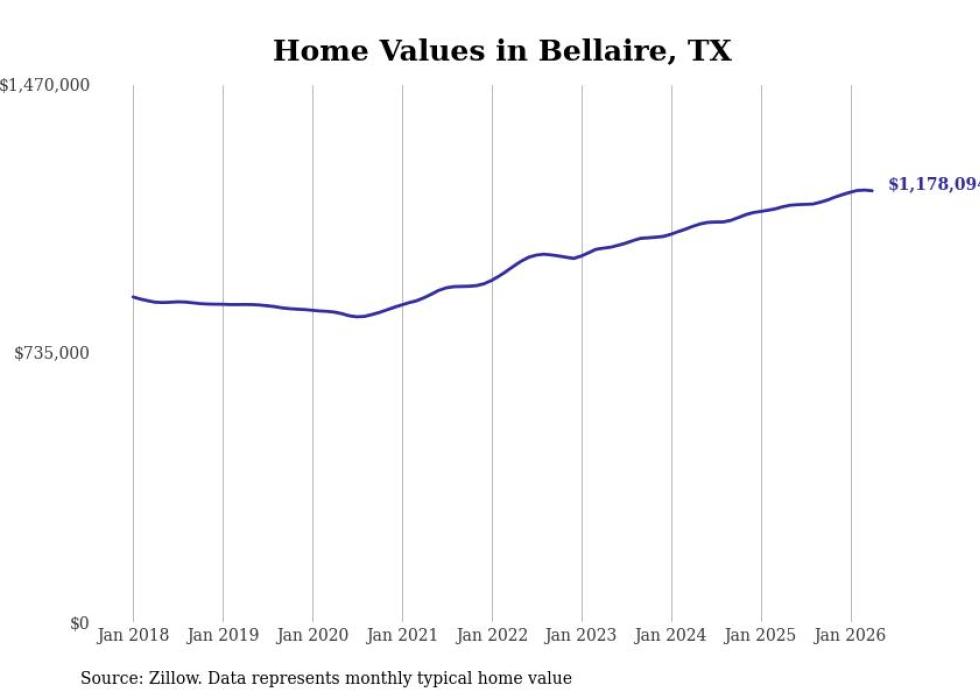
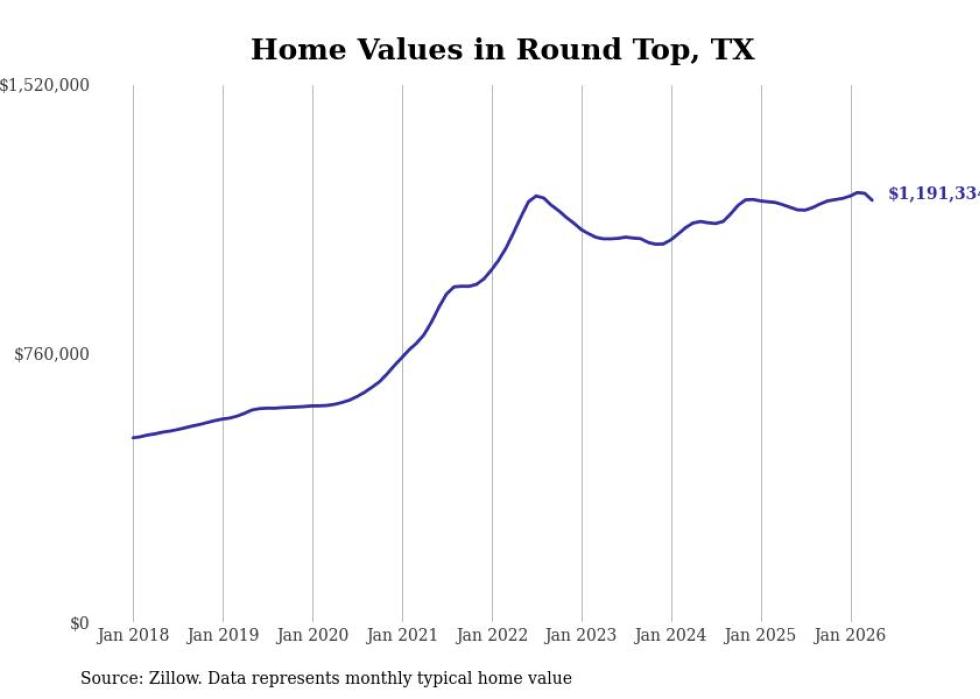
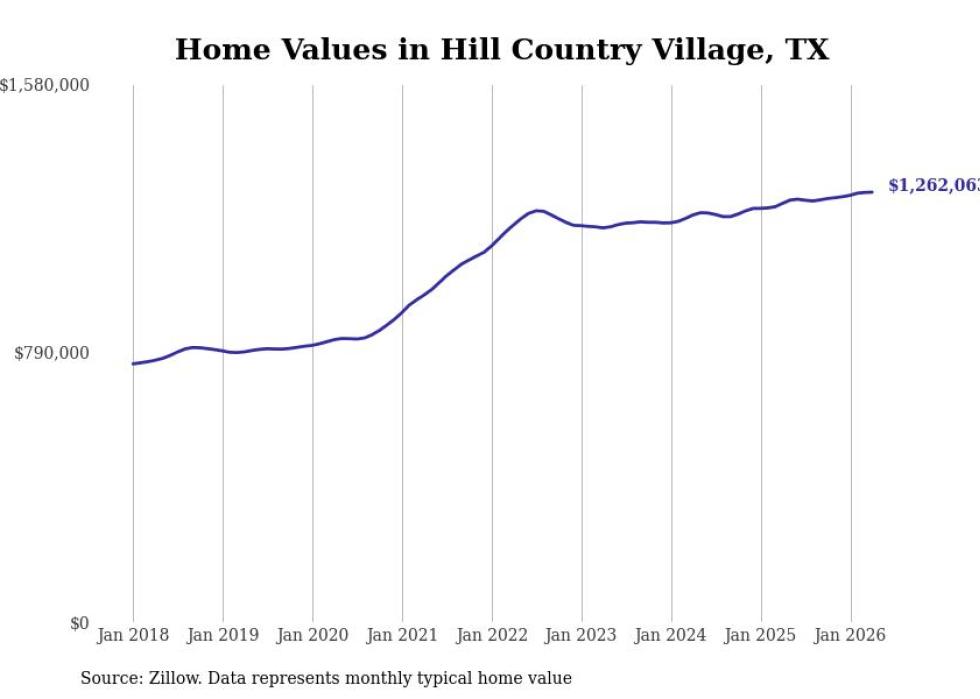
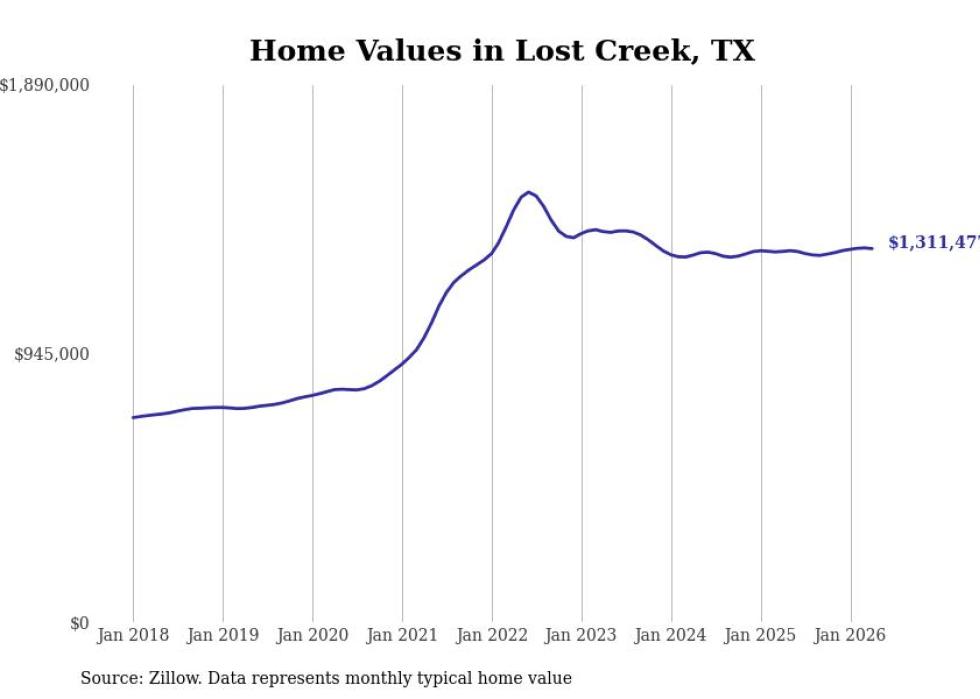
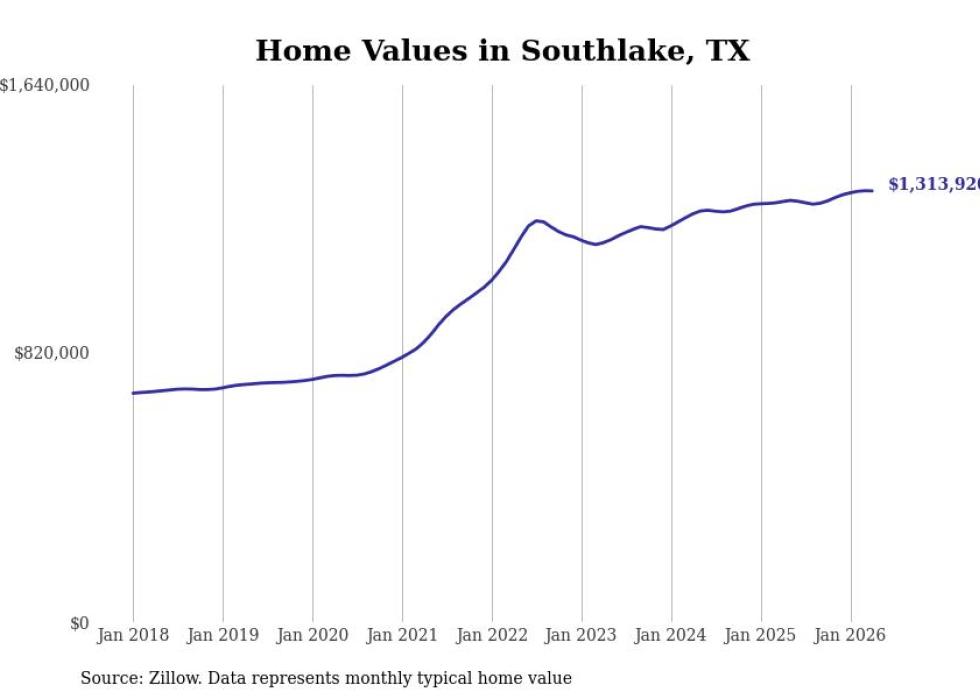
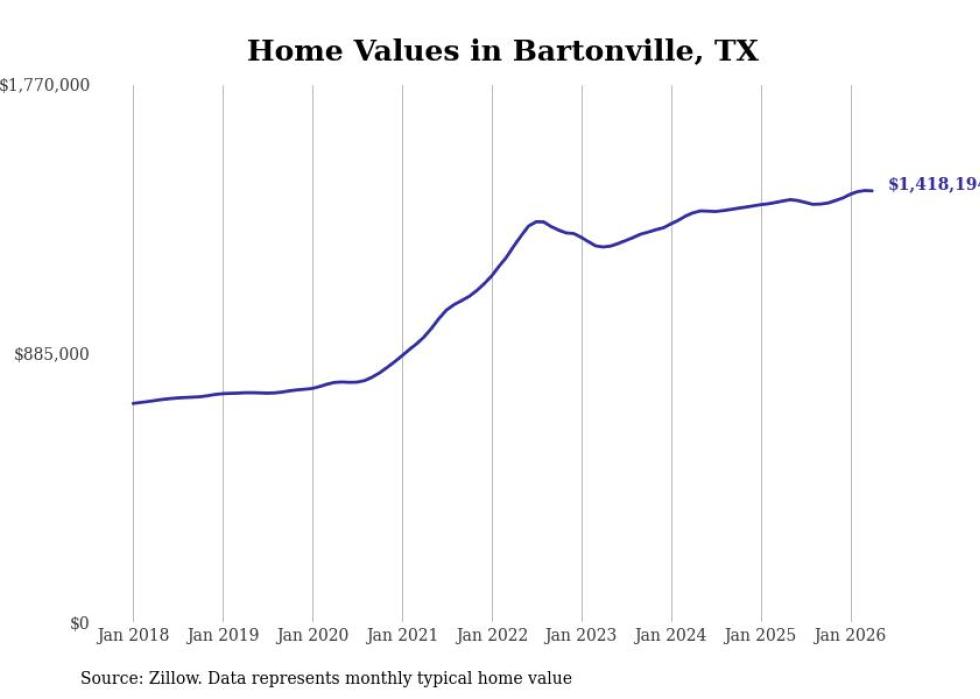
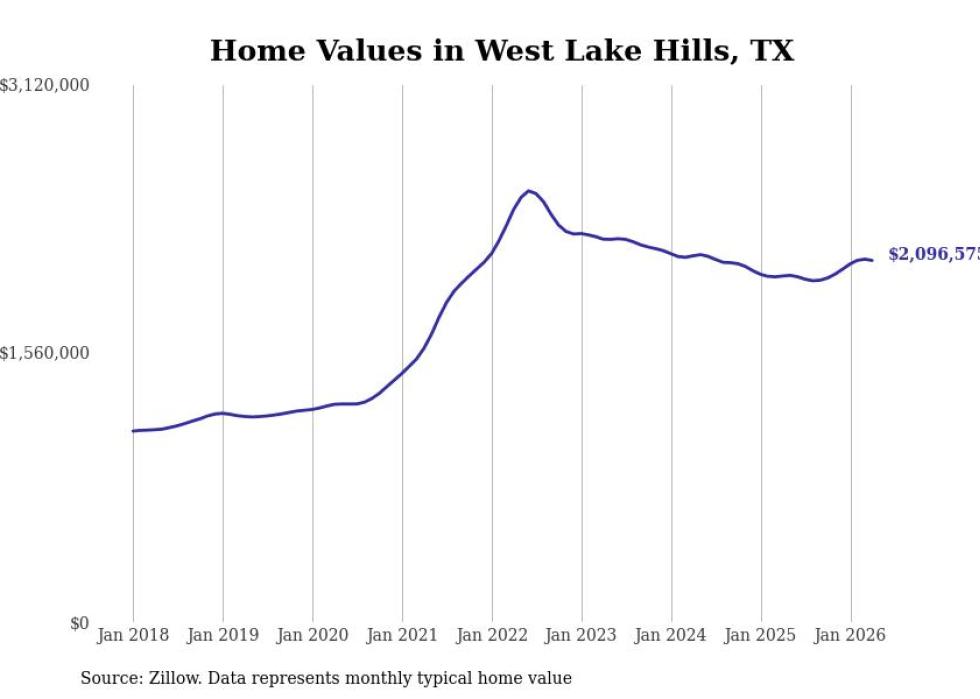
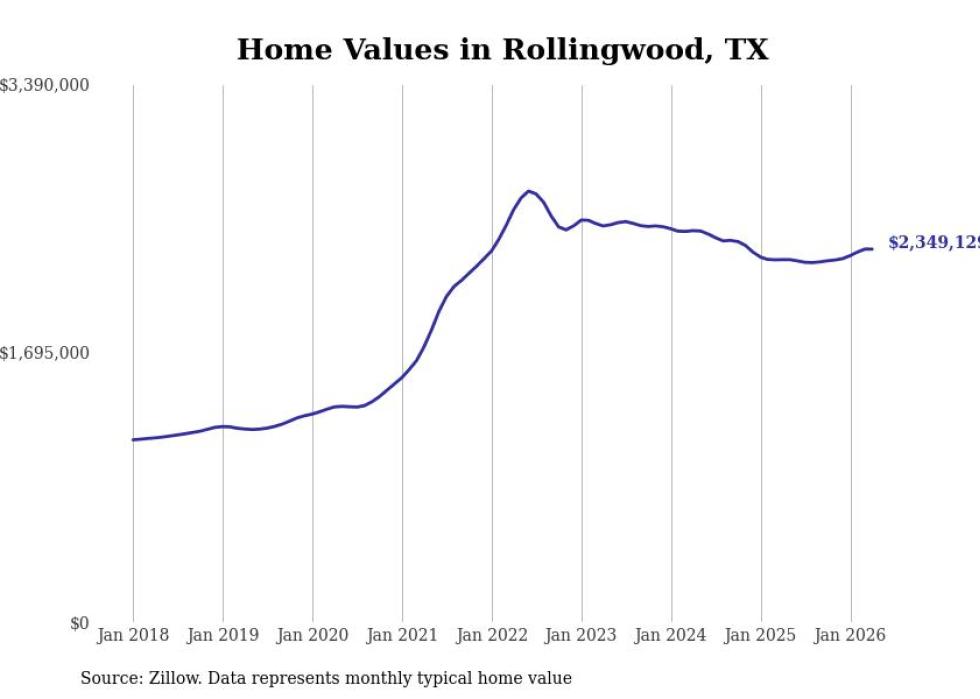
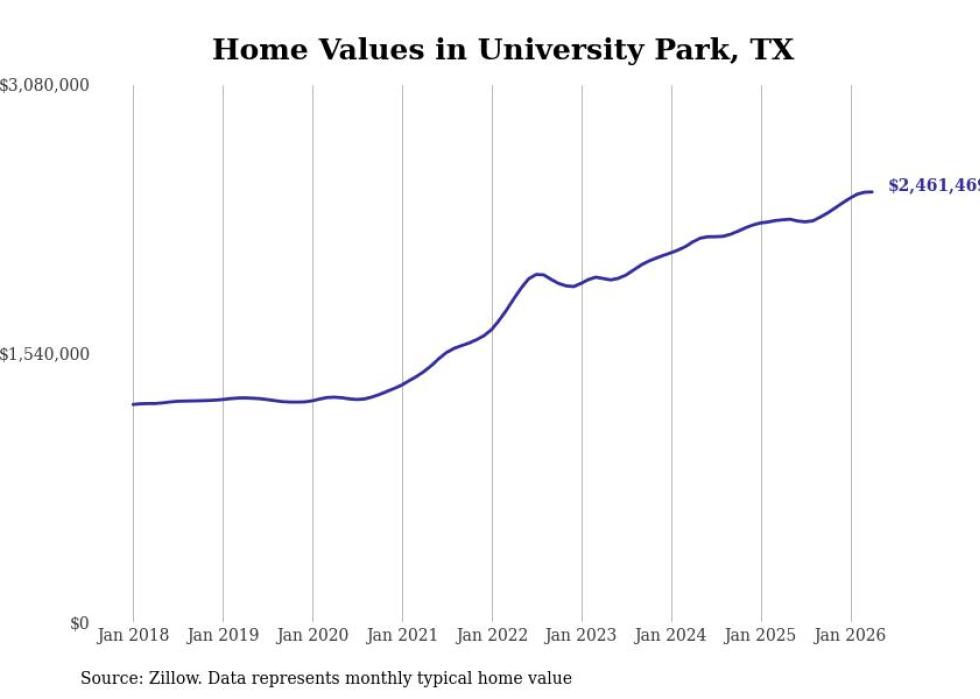
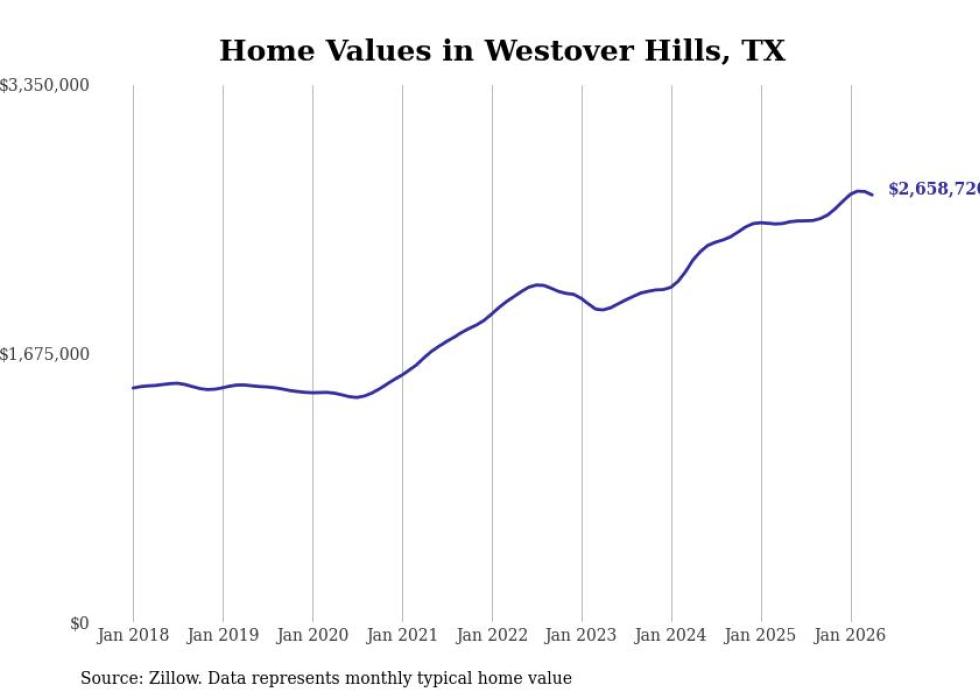
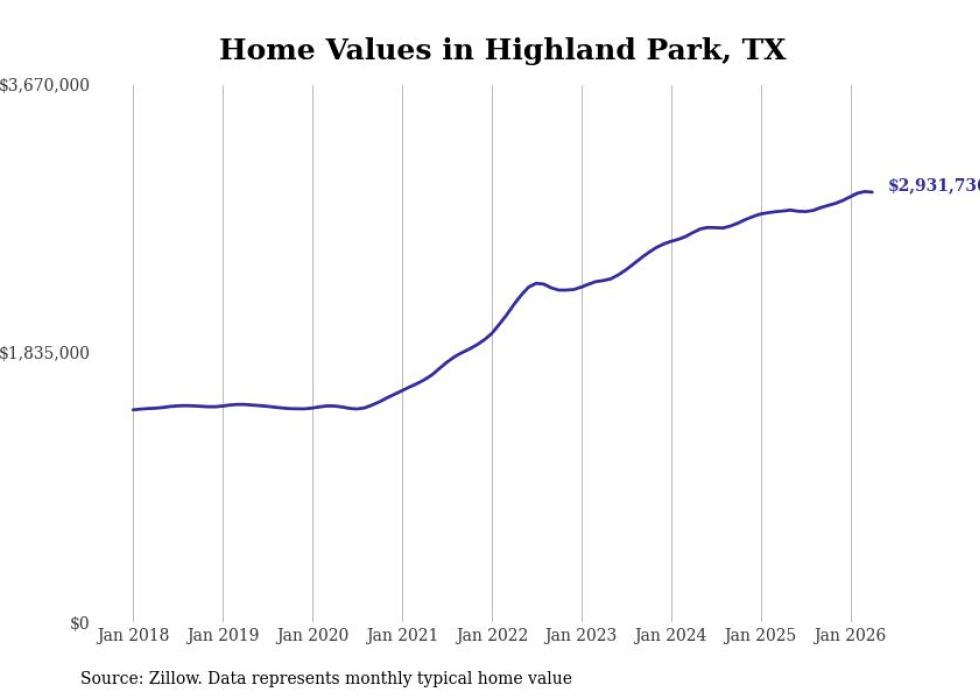
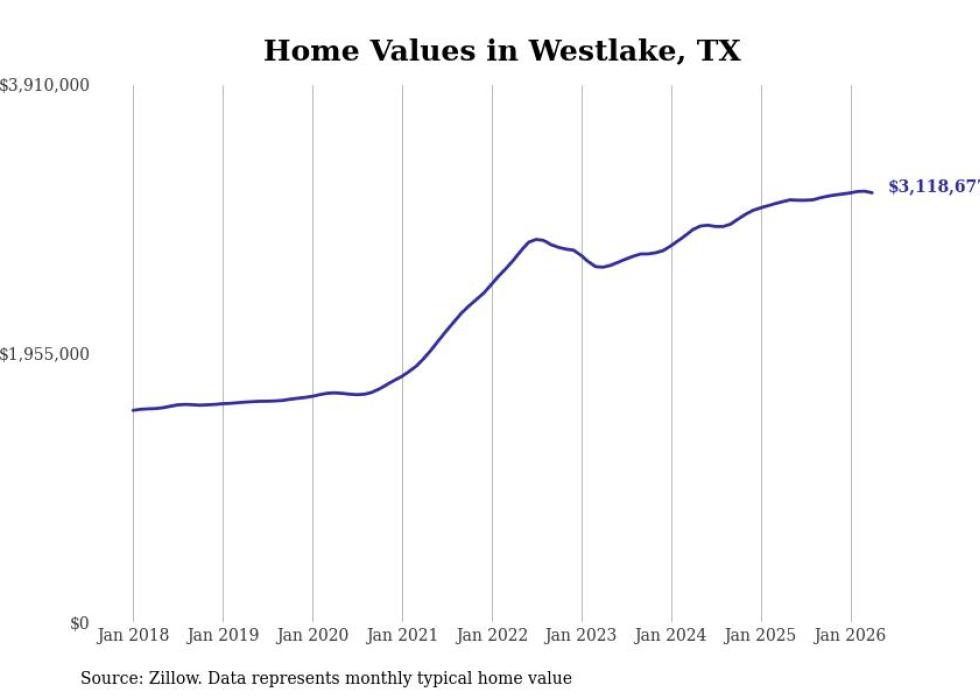
compiled a list of cities with the most expensive homes in Texas using data from . Cities are ranked by the Zillow Home Values Index for all homes as of December 2025. The charts in this story were created automatically using .
Metros with the most cities in the top 30 in Texas
#1. Dallas-Fort Worth-Arlington, TX: 13
#2. Austin-Round Rock-Georgetown, TX: 8
#3. San Antonio-New Braunfels, TX: 5
#4. Houston-The Woodlands-Sugar Land, TX: 1
#30. Pecan Acres
- Typical home value: $725,381
- 1-year price change: +0.3%
- 5-year price change: +41.7%
- Metro area: Dallas-Fort Worth-Arlington, TX
#29. Sunrise Beach
- Typical home value: $773,315
- 1-year price change: -4.3%
- 5-year price change: +36.6%
- Metro area: not in a metro area
#28. Prosper
- Typical home value: $790,618
- 1-year price change: -4.5%
- 5-year price change: +52.9%
- Metro area: Dallas-Fort Worth-Arlington, TX
#27. The Hills
- Typical home value: $793,982
- 1-year price change: -3.6%
- 5-year price change: +34.3%
- Metro area: Austin-Round Rock-Georgetown, TX
#26. Kendalia
- Typical home value: $798,593
- 1-year price change: -0.1%
- 5-year price change: +36.7%
- Metro area: San Antonio-New Braunfels, TX
#25. Double Oak
- Typical home value: $840,366
- 1-year price change: -0.2%
- 5-year price change: +49.3%
- Metro area: Dallas-Fort Worth-Arlington, TX
#24. Round Mountain
- Typical home value: $848,524
- 1-year price change: -3.4%
- 5-year price change: data not available
- Metro area: not in a metro area
#23. Bee Cave
- Typical home value: $861,829
- 1-year price change: -5.6%
- 5-year price change: +27.4%
- Metro area: Austin-Round Rock-Georgetown, TX
#22. Terrell Hills
- Typical home value: $869,431
- 1-year price change: +1.2%
- 5-year price change: +30.1%
- Metro area: San Antonio-New Braunfels, TX
#21. Colleyville
- Typical home value: $883,929
- 1-year price change: +0.9%
- 5-year price change: +52.4%
- Metro area: Dallas-Fort Worth-Arlington, TX
#20. Driftwood
- Typical home value: $900,940
- 1-year price change: -3.9%
- 5-year price change: +37.8%
- Metro area: Austin-Round Rock-Georgetown, TX
#19. Sunset Valley
- Typical home value: $903,855
- 1-year price change: -7.2%
- 5-year price change: +27.1%
- Metro area: Austin-Round Rock-Georgetown, TX
#18. Shavano Park
- Typical home value: $912,494
- 1-year price change: +1.0%
- 5-year price change: +39.5%
- Metro area: San Antonio-New Braunfels, TX
#17. Olmos Park
- Typical home value: $927,529
- 1-year price change: +1.5%
- 5-year price change: +30.5%
- Metro area: San Antonio-New Braunfels, TX
#16. Volente
- Typical home value: $988,312
- 1-year price change: -5.4%
- 5-year price change: +28.0%
- Metro area: Austin-Round Rock-Georgetown, TX
#15. Lucas
- Typical home value: $1,056,166
- 1-year price change: -1.0%
- 5-year price change: +52.7%
- Metro area: Dallas-Fort Worth-Arlington, TX
#14. Parker
- Typical home value: $1,068,987
- 1-year price change: -0.4%
- 5-year price change: +56.1%
- Metro area: Dallas-Fort Worth-Arlington, TX
#13. Copper Canyon
- Typical home value: $1,072,201
- 1-year price change: +0.8%
- 5-year price change: +56.7%
- Metro area: Dallas-Fort Worth-Arlington, TX
#12. Bellaire
- Typical home value: $1,135,703
- 1-year price change: +4.4%
- 5-year price change: +35.8%
- Metro area: Houston-The Woodlands-Sugar Land, TX
#11. Hill Country Village
- Typical home value: $1,219,291
- 1-year price change: +2.8%
- 5-year price change: +40.5%
- Metro area: San Antonio-New Braunfels, TX
#10. Lost Creek
- Typical home value: $1,246,377
- 1-year price change: +0.3%
- 5-year price change: +47.3%
- Metro area: Austin-Round Rock-Georgetown, TX
#9. Southlake
- Typical home value: $1,255,061
- 1-year price change: +2.3%
- 5-year price change: +63.8%
- Metro area: Dallas-Fort Worth-Arlington, TX
#8. Round Top
- Typical home value: $1,266,637
- 1-year price change: +0.3%
- 5-year price change: +65.1%
- Metro area: not in a metro area
#7. Bartonville
- Typical home value: $1,361,734
- 1-year price change: +1.9%
- 5-year price change: +63.0%
- Metro area: Dallas-Fort Worth-Arlington, TX
#6. West Lake Hills
- Typical home value: $1,947,335
- 1-year price change: +0.5%
- 5-year price change: +45.8%
- Metro area: Austin-Round Rock-Georgetown, TX
#5. Rollingwood
- Typical home value: $2,213,097
- 1-year price change: -1.7%
- 5-year price change: +52.6%
- Metro area: Austin-Round Rock-Georgetown, TX
#4. University Park
- Typical home value: $2,336,599
- 1-year price change: +5.6%
- 5-year price change: +79.4%
- Metro area: Dallas-Fort Worth-Arlington, TX
#3. Westover Hills
- Typical home value: $2,615,167
- 1-year price change: +5.6%
- 5-year price change: +73.3%
- Metro area: Dallas-Fort Worth-Arlington, TX
#2. Highland Park
- Typical home value: $2,799,655
- 1-year price change: +3.9%
- 5-year price change: +85.0%
- Metro area: Dallas-Fort Worth-Arlington, TX
#1. Westlake
- Typical home value: $3,062,233
- 1-year price change: +4.0%
- 5-year price change: +77.0%
- Metro area: Dallas-Fort Worth-Arlington, TX