Cities with the highest flood risk in every state

Written by:
August 10, 2020
Cire notrevo // Shutterstock

Cities with the highest flood risk in every state

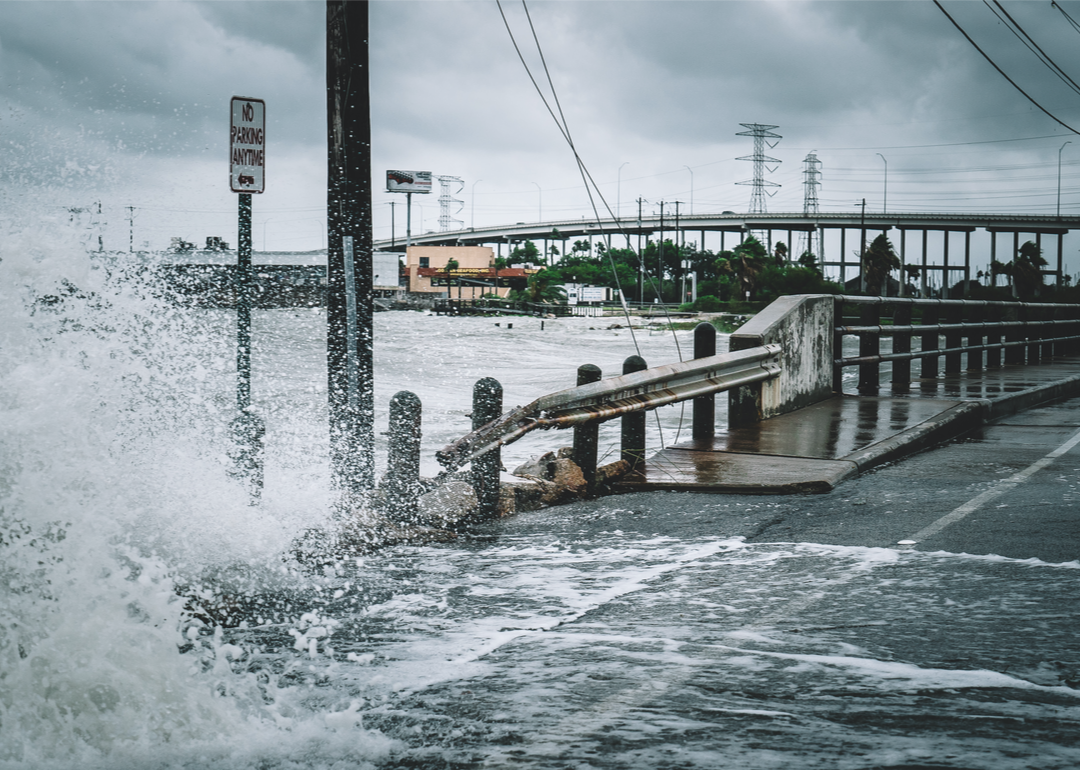
Floods accounted for three of the 14 that caused at least $1 billion in damage in the United States in 2019. In total, flooding impacted 14 million Americans last year and put another 200 million at risk鈥攁nd that doesn't even take into account hurricanes and other extreme weather events that often lead to flooding.

The most common natural disaster in the United States, floods can occur anywhere in the country at any time of year鈥攁nd like all natural disasters, global warming is making them more frequent and more severe. They're often the result of heavy rainfall, but snowmelt can cause destructive flooding, too, as can ice jams in rivers, storm surges, and overwhelmed drainage systems.

Standard homeowners insurance does not cover flood damage. In order to determine which businesses and homes must be covered by supplementary flood insurance, the Federal Emergency Management Agency (FEMA) based on the likelihood that they'll experience a flood. Zones with a 1% chance of flooding every single year are considered to be at-risk. Since 1% represents one in 100, this formula sometimes refers to "100-year floods." That language does not indicate flooding so severe that it happens only once in a century. It's important to understand this because the 1%/100-year flood benchmark is the standard for determining which regions are most vulnerable.

As readers will see with several states on this list, recent studies have shown that FEMA's mapping is often wildly inaccurate in terms of how many structures are truly at risk in each state. Among the most credible is a report issued by a nonprofit called The First Street Foundation.

To find the cities with the highest flood risk in every state, 麻豆原创 analyzed the First Street Foundation's National released June 29, 2020. The First Street model identifies any property at risk of flooding one centimeter or more over the next 30 years. Using a broader definition than FEMA, the First Street model identified 23.5 million properties as at risk, with 3.6 million categorized as facing almost certain risk. Regrettably, data from Alaska and Hawaii were not available. Any ties in the proportion of properties under threat were broken using the city with the higher number of properties at threat.

1 / 48
GTD7 // Shutterstock

Alabama

- Most properties at risk: Mobile (24,070 properties at risk; 29% of all properties)
- Highest share of properties at risk: Dauphin Island (88% of all properties; 3,071 properties at risk)
- Highest projected increase: Satsuma
--- Properties at risk in 2020: 772 (25% of all properties)
--- Properties at risk in 2050: 1,778 (57% of all properties)

Both and more severe in recent years in Alabama, according to the Pew Charitable Trusts. Flooding, the second most common natural disaster in the state, occurs every 12 days on average there. Coastal counties like Baldwin and Mobile are especially vulnerable to flooding induced by storm surges.

2 / 48
Andrew Zarivny // Shutterstock

Arizona

- Most properties at risk: Phoenix (62,351 properties at risk; 13% of all properties)
- Highest share of properties at risk: Wilcox (65% of all properties; 2,728 properties at risk)
- Highest projected increase: Somerton
--- Properties at risk in 2020: 375 (9% of all properties)
--- Properties at risk in 2050: 431 (11% of all properties)

Like the United States as a whole, flooding is the in Arizona. The state experiences between 40 and 100 floods a year, and residents have suffered from 116 severe floods in the last decade. Flooding is most common there in the wake of winter storms and monsoon storms, particularly in fire-damaged areas.

3 / 48
Joseph Sohm // Shutterstock

Arkansas

- Most properties at risk: North Little Rock (9,140 properties at risk; 33% of all properties)
- Highest share of properties at risk: Rockwell (46% of all properties; 1,004 properties at risk)
- Highest projected increase: Dermott
--- Properties at risk in 2020: 123 (5% of all properties)
--- Properties at risk in 2050: 141 (6% of all properties)

From the Great Floods of 1915 and 1927 to the April 1945 Flood and the Albert Pike Flood of June 11, 2010, since Arkansas was still a territory. Flash floods are common to the state, as are river flooding, coastal flooding from tropical storms, and floods resulting from failed dams or levees. Snowmelt, ice jams, and water-repelling burn scars all contribute to or cause floods, as well.

4 / 48
TierneyMJ // Shutterstock

California

- Most properties at risk: Los Angeles (132,046 properties at risk; 20% of all properties)
- Highest share of properties at risk: Yuba City (100% of all properties; 19,174 properties at risk)
- Highest projected increase: Coronado
--- Properties at risk in 2020: 103 (2% of all properties)
--- Properties at risk in 2050: 1,142 (24% of all properties)

Every single county in California has been declared a flood disaster area several times. While virtually all of the state is vulnerable, the most at-risk areas are those that suffered burn scars from California鈥檚 notorious annual wildfires, urban areas with poor drainage systems, low-lying coastal areas, and the state鈥檚 many valleys. According to the Public Policy Institute of California, the for flood mitigation and management.

5 / 48
John Hoffman // Shutterstock

Colorado

- Most properties at risk: Colorado Springs (15,440 properties at risk; 10% of all properties)
- Highest share of properties at risk: Lamar (46% of all properties; 1,621 properties at risk)
- Highest projected increase: Edgewater
--- Properties at risk in 2020: 1,626 (15% of all properties)
--- Properties at risk in 2050: 1,700 (18% of all properties)

In 2013, thousands of homes and hundreds of miles of roadways in Colorado鈥攖he state is just now finishing rebuilding and repairing several years later. The silver lining is that the trauma forced a dramatic shift in thinking among state officials. The roads, homes, infrastructure, and natural environments that were destroyed were largely built back stronger and more resistant to future flooding.

6 / 48
Allan Wood Photography // Shutterstock

Connecticut

- Most properties at risk: Bridgeport (5,836 properties at risk; 21% of all properties)
- Highest share of properties at risk: Old Greenwich (31% of all properties; 725 properties at risk)
- Highest projected increase: West Haven
--- Properties at risk in 2020: 1,824 (13% of all properties)
--- Properties at risk in 2050: 2,971 (21% of all properties)

Connecticut officials have conducted assessments, ordered widespread tree-trimming programs around utility lines, improved drainage systems, and ordered hundreds of shoreline homes to be raised. Those efforts, however, seem like temporary fixes to officials who understand just how vulnerable the state is to severe, long-term, and widespread flooding. Global warming has increased the frequency and severity of major storms so significantly that catastrophic shoreline erosion has put Connecticut just from a statewide flood crisis.

7 / 48
Harry Collins Photography // Shutterstock

Delaware

- Most properties at risk: Bethany Beach (2,135 properties at risk; 97% of all properties)
- Highest share of properties at risk: Bethany Beach (97% of all properties; 2,135 properties at risk)
- Highest projected increase: Rehoboth Beach
--- Properties at risk in 2020: 33 (2% of all properties)
--- Properties at risk in 2050: 247 (11% of all properties)

According to States at Risk, climate change has caused and between 2005 and 2014, 67% of the state鈥檚 214 total floods were classified as 鈥渉uman-caused.鈥 Thanks mostly to an increase in Atlantic hurricanes, 22,000 people are at risk of flooding, and rising sea levels are expected to add 9,000 more to that tally by 2050.

8 / 48
Nadezda Murmakova // Shutterstock

Florida

- Most properties at risk: Cape Coral (111,237 properties at risk; 86% of all properties)
- Highest share of properties at risk: Warm Mineral Springs (100% of all properties; 5,097 properties at risk)
- Highest projected increase: Golden Gate
--- Properties at risk in 2020: 153 (3% of all properties)
--- Properties at risk in 2050: 4,000 (76% of all properties)

Surrounded on three sides by rising seas, Florida is home to America鈥檚 longest sea coast and is defined by flat terrain, low elevation, and a high water table鈥 to lose cities to water in the coming decades. Cities like Miami have invested hundreds of millions of dollars in stormwater projects, but the state鈥檚 geography, its location in the heart of hurricane country, and the onslaught of global warming make Florida鈥檚 long-term outlook bleak.

9 / 48
Brett Barnhill // Shutterstock

Georgia

- Most properties at risk: Atlanta (14,227 properties at risk; 11% of all properties)
- Highest share of properties at risk: Brunswick (100% of all properties; 6,815 properties at risk)
- Highest projected increase: Adel
--- Properties at risk in 2020: 80 (3% of all properties)
--- Properties at risk in 2050: 146 (5% of all properties)

North of Florida is Georgia, which in 2009鈥攖hree out of four Georgia counties were declared federal disaster areas due to severe flooding over the last 15 years. The main cause is thunderstorms, but increasingly strong and frequent hurricanes and tropical storms, as well as rising sea levels, aggressive erosion, and greater overall rainfall, are taking their toll, as well.

10 / 48
Charles Knowles // Shutterstock

Idaho

- Most properties at risk: Boise City (15,529 properties at risk; 19% of all properties)
- Highest share of properties at risk: Blackfoot (81% of all properties; 3,881 properties at risk)
- Highest projected increase: Fruitland
--- Properties at risk in 2020: 77 (4% of all properties)
--- Properties at risk in 2050: 103 (5% of all properties)

In Idaho, the annual rituals of are part of life鈥攖he phenomenon is both a blessing and a curse. Too little and the state is at risk of drought and low reservoirs. Too much and the result is gorged rivers and widespread flooding.

11 / 48
DiegoMariottini // Shutterstock

Illinois

- Most properties at risk: Chicago (154,824 properties at risk; 26% of all properties)
- Highest share of properties at risk: Stickney (91% of all properties; 2,069 properties at risk)
- Highest projected increase: Morton Grove
--- Properties at risk in 2020: 264 (3% of all properties)
--- Properties at risk in 2050: 340 (4% of all properties)

In 2014, Illinois passed the , which 鈥渢asked the Illinois Department of Natural Resources (IDNR) to prepare a report on the extent, cost, prevalence, and policies related to urban flooding in Illinois and to identify resources and technology that may lead to mitigation of the impact of urban flooding.鈥 Every year, the agency compiles an extensive report outlining potential risks and preventative measures.

12 / 48
Jonathan Weiss // Shutterstock

Indiana

- Most properties at risk: Indianapolis (34,124 properties at risk; 11% of all properties)
- Highest share of properties at risk: Peru (91% of all properties; 4,859 properties at risk)
- Highest projected increase: Brownsburg
--- Properties at risk in 2020: 432 (4% of all properties)
--- Properties at risk in 2050: 496 (5% of all properties)

In 2018, that was eerily reminiscent of devastating river overflows that drowned the state in 1950. Heavy winter snowfall combined with an unseasonably rainy spring to overfill the state鈥檚 many networks of rivers, streams, and creeks, causing them to rise and overflow. The result in both cases was so catastrophic that it flirted with 500-year flood status.

13 / 48
Melissa A. Woolf // Shutterstock

Iowa

- Most properties at risk: Council Bluffs (10,989 properties at risk; 13% of all properties)
- Highest share of properties at risk: Evansdale (62% of all properties; 1,550 properties at risk)
- Highest projected increase: Shenandoah
--- Properties at risk in 2020: 403 (15% of all properties)
--- Properties at risk in 2050: 422 (15% of all properties)

Iowa created the , which 鈥減uts science-based information and technology in the hands of Iowa鈥檚 decision-makers, emergency managers, home- and business-owners, and the general public.鈥 The organization was formed in 2008 after record-setting floods ravaged Eastern Iowa. Among its innovations are a stream-monitoring network of sensors and a floodplain map cataloging all 99 counties in the state.

14 / 48
mojoeks // Shutterstock

Kansas

- Most properties at risk: Wichita (16,034 properties at risk; 10% of all properties)
- Highest share of properties at risk: Haysville (34% of all properties; 1,494 properties at risk)
- Highest projected increase: Valley Center
--- Properties at risk in 2020: 1,085 (33% of all properties)
--- Properties at risk in 2050: 1,185 (36% of all properties)

that has suffered human deaths and millions of dollars in damage related to flooding. The United States Geological Survey monitors 180 streamgages throughout the state and the National Weather Service uses water flow and level data to make reliable flood forecasts.

15 / 48
Thomas Kelley // Shutterstock

Kentucky

- Most properties at risk: Louisville/Jefferson (14,956 properties at risk; 11% of all properties)
- Highest share of properties at risk: Hazard (32% of all properties; 746 properties at risk)
- Highest projected increase: Farley
--- Properties at risk in 2020: 135 (6% of all properties)
--- Properties at risk in 2050: 487 (22% of all properties)

Kentucky is so disproportionately prone to flooding that even though it's home to just 1% of the country's population, it of total American flood deaths between 1996 and 2019. The vast majority of those deaths鈥64%鈥攊nvolved people trapped in vehicles.

16 / 48
Tim Roberts Photography // Shutterstock

Louisiana

- Most properties at risk: New Orleans (148,197 properties at risk; 98% of all properties)
- Highest share of properties at risk: Metairie (100% of all properties; 64,424 properties at risk)
- Highest projected increase: Franklin
--- Properties at risk in 2020: 478 (9% of all properties)
--- Properties at risk in 2050: 5,390 (98% of all properties)

The most enduring images of flooding in modern American history come from the nightmare that was New Orleans in the wake of Hurricane Katrina. Louisiana is not only prone to hurricanes and tropical storms鈥攊t鈥檚 located at the southernmost dumping-off point of the Mississippi River Basin, which is the on the entire continent.

17 / 48
PhotoItaliaStudio // Shutterstock

Maine

- Most properties at risk: Portland (2,381 properties at risk; 8% of all properties)
- Highest share of properties at risk: Brewer (22% of all properties; 836 properties at risk)
- Highest projected increase: Old Orchard Beach
--- Properties at risk in 2020: 643 (16% of all properties)
--- Properties at risk in 2050: 1,151 (29% of all properties)

Because of Maine鈥檚 unique climate and geography, tend to be fast but short. The most common floods are the result of overflowed rivers and streams, sometimes due to ice jams, and flash flooding or urban flooding.

18 / 48
Andrei Medvedev // Shutterstock

Maryland

- Most properties at risk: Baltimore (13,705 properties at risk; 6% of all properties)
- Highest share of properties at risk: Ocean City (85% of all properties; 6,319 properties at risk)
- Highest projected increase: Chester
--- Properties at risk in 2020: 260 (10% of all properties)
--- Properties at risk in 2050: 671 (26% of all properties)

According to , the Old Line State faces an especially severe threat from flooding due to global warming. Both temperatures and sea levels are rising in Maryland, and the frequency and severity of storms are at historic levels across the entire Maryland-D.C.-Virginia region. The Chesapeake Bay region and Maryland鈥檚 large swaths of farmland face the greatest risk of near-future flooding.

19 / 48
Alex Paul // Shutterstock

Massachusetts

- Most properties at risk: Boston (19,177 properties at risk; 19% of all properties)
- Highest share of properties at risk: Hull (65% of all properties; 3,056 properties at risk)
- Highest projected increase: Dennis Port
--- Properties at risk in 2020: 364 (10% of all properties)
--- Properties at risk in 2050: 1,452 (38% of all properties)

The Massachusetts Office of Coastal Zone Management (CZM) created the which provides virtual maps that both officials and the public can use to determine which areas are most vulnerable to coastal flooding and storm surge. According to Massachusetts Wildlife, 鈥淩egional increases in heavy precipitation events exceed that of the rest of the United States with a 74% increase in the heaviest 1% of all precipitation events since 1958. Flood events have risen in association with increases in precipitation, particularly extreme events.鈥

20 / 48
NicoleTaklaPhotography // Shutterstock

Michigan

- Most properties at risk: Detroit (39,744 properties at risk; 10% of all properties)
- Highest share of properties at risk: River Rouge (81% of all properties; 3,160 properties at risk)
- Highest projected increase: Milan
--- Properties at risk in 2020: 157 (6% of all properties)
--- Properties at risk in 2050: 197 (8% of all properties)

Michigan has been no stranger to from the early 1900s throughout today, but waters have been rising more frequently and severely in recent years. Historic Grand Rapids River flooding soaked the state in 2013 and the very next year in 2014, equally-ferocious urban flooding damaged large swaths of Detroit. Flash flooding, usually caused by heavy rain, is common in the state.

21 / 48
Scruggelgreen // Shutterstock

Minnesota

- Most properties at risk: Minneapolis (10,730 properties at risk; 11% of all properties)
- Highest share of properties at risk: East Grand Forks (55% of all properties; 1,960 properties at risk)
- Highest projected increase: Waite Park
--- Properties at risk in 2020: 245 (11% of all properties)
--- Properties at risk in 2050: 265 (11% of all properties)

In 2018, that the most up-to-date FEMA flood mapping only covered about half of the United States鈥 truly at-risk regions. Minnesota, which is especially vulnerable to 100-year flooding events, fared even worse than the nation as a whole. Most of the Land of 10,000 Lakes is not covered by FEMA鈥檚 flood mapping system.

22 / 48
SNEHIT PHOTO // Shutterstock

Mississippi

- Most properties at risk: Jackson (10,287 properties at risk; 14% of all properties)
- Highest share of properties at risk: Pascagoula (98% of all properties; 9,706 properties at risk)
- Highest projected increase: Ocean Springs
--- Properties at risk in 2020: 1,824 (21% of all properties)
--- Properties at risk in 2050: 4,847 (57% of all properties)

Forty-one of America鈥檚 48 contiguous states dump water into the Mississippi River Basin, the fourth-largest drainage basin on Earth鈥擬ississippi is located at the bottom where the funnel reaches its most narrow point. , streams, and tributaries by any means, the Mississippi Delta and its sprawling network of levees are now facing historic pressure. In 2019, the state was at the heart of an unprecedented multi-state river flood that continues today.

23 / 48
TommyBrison // Shutterstock

Missouri

- Most properties at risk: Kansas City (14,927 properties at risk; 8% of all properties)
- Highest share of properties at risk: Valley Park (33% of all properties; 918 properties at risk)
- Highest projected increase: Pacific
--- Properties at risk in 2020: 413 (14% of all properties)
--- Properties at risk in 2050: 470 (16% of all properties)

Like Mississippi, Missouri is a state with 鈥攁lso like Mississippi, it鈥檚 as bad or worse now than it鈥檚 ever been. Floods killed 50 people there between 2015 and 2019, but that year, the historic Mississippi River catastrophe in Missouri, devastating farms, homes, levees, and land.

24 / 48
Keegan Connell // Shutterstock

Montana

- Most properties at risk: Missoula (6,607 properties at risk; 27% of all properties)
- Highest share of properties at risk: Evergreen (81% of all properties; 2,338 properties at risk)
- Highest projected increase: Belgrade
--- Properties at risk in 2020: 275 (7% of all properties)
--- Properties at risk in 2050: 346 (9% of all properties)

Opposite the country from the Mississippi Delta is Montana, where a different set of contribute to frequent flooding. In 2018, flooding devastated Helena, Missoula, and other parts of the state. The most common causes in Montana are massive spring snow melts and river ice jams.

25 / 48
Kristopher Kettner // Shutterstock

Nebraska

- Most properties at risk: Omaha (12,616 properties at risk; 8% of all properties)
- Highest share of properties at risk: Columbus (45% of all properties; 4,171 properties at risk)
- Highest projected increase: Schuyler
--- Properties at risk in 2020: 41 (2% of all properties)
--- Properties at risk in 2050: 64 (3% of all properties)

2019 was a gruesome year for Nebraska in terms of flooding, but it was the direct result of a weather phenomenon known as a bomb cyclone, which tore through the Midwest over the course of a single week that year. The result was flooding that caused more than $1 billion in damage, destroyed thousands of homes, and left several people dead. , "I don't think there's ever been a disaster this widespread in Nebraska."

26 / 48
Don Mammoser // Shutterstock

Nevada

- Most properties at risk: Reno (14,214 properties at risk; 17% of all properties)
- Highest share of properties at risk: Gardnerville (30% of all properties; 749 properties at risk)
- Highest projected increase: Humboldt River Ranch
--- Properties at risk in 2020: 117 (6% of all properties)
--- Properties at risk in 2050: 139 (7% of all properties)

, 鈥淭he lowest annual average precipitation and one of the fastest-growing populations in the United States contribute to a tendency for both the general public and land-use planners to underestimate flood hazards in Nevada, despite historical evidence of frequent flooding.鈥 River flooding and flash floods are the two most common kinds of floods that threaten the state.

27 / 48
Jon Bilous // Shutterstock

New Hampshire

- Most properties at risk: Manchester (4,184 properties at risk; 14% of all properties)
- Highest share of properties at risk: Littleton (27% of all properties; 555 properties at risk)
- Highest projected increase: Portsmouth
--- Properties at risk in 2020: 815 (13% of all properties)
--- Properties at risk in 2050: 1,104 (17% of all properties)

According to the New Hampshire Business Review, nearly 65,000 properties in the state are at 鈥攁 much higher number than that offered by FEMA鈥檚 national flood mapping. As in most of the country, those risks will grow substantially in the coming years due to climate change鈥攁 factor that FEMA doesn鈥檛 consider in its mapping projections.

28 / 48
Andrew Pilecki // Shutterstock

New Jersey

- Most properties at risk: Ocean City (17,255 properties at risk; 81% of all properties)
- Highest share of properties at risk: Wildwood (98% of all properties; 4,371 properties at risk)
- Highest projected increase: Bradley Beach
--- Properties at risk in 2020: 20 (1% of all properties)
--- Properties at risk in 2050: 848 (38% of all properties)

of FEMA鈥檚 flood mapping put New Jersey in a rare category. FEMA flood maps almost always underestimate the flood vulnerability of states, but New Jersey is one of only three states where federal mapping overstated the number of vulnerable properties. The First Street Foundation report concluded that 8,112 Garden State households are mapped in mandatory flood insurance zones that should not be.

29 / 48
gmeland // Shutterstock

New Mexico

- Most properties at risk: Albuquerque (16,540 properties at risk; 9% of all properties)
- Highest share of properties at risk: Lovington (85% of all properties; 4,503 properties at risk)
- Highest projected increase: North Valley
--- Properties at risk in 2020: 1,432 (30% of all properties)
--- Properties at risk in 2050: 1,553 (32% of all properties)

is a hot, dry Southwestern state whose vast areas of parched earth are not capable of absorbing water quickly. The state鈥檚 unique terrain can channel large amounts of rainfall through narrow passes to places where it hasn鈥檛 even rained. This dynamic makes flash flooding an especially serious threat in New Mexico.

30 / 48
T photography // Shutterstock

New York

- Most properties at risk: New York (121,202 properties at risk; 14% of all properties)
- Highest share of properties at risk: Hornell (75% of all properties; 2,757 properties at risk)
- Highest projected increase: Merrick
--- Properties at risk in 2020: 1,847 (23% of all properties)
--- Properties at risk in 2050: 5,016 (63% of all properties)

New York is home to , much of which commonly floods from coastal surges in hurricanes, hurricane remnants, and other serious storms. With snowmelts in the cold and mountainous northern upstate region and riverine flood hazards along its many inland waterways, , and that risk will continue to grow as temperatures and water levels rise. Among the most vulnerable is the frequently-flooded New York City region, including Long Island鈥攆our out of five NYC boroughs are islands.

31 / 48
digidreamgrafix // Shutterstock

North Carolina

- Most properties at risk: Charlotte (17,545 properties at risk; 7% of all properties)
- Highest share of properties at risk: Avon (94% of all properties; 2,052 properties at risk)
- Highest projected increase: Plymouth
--- Properties at risk in 2020: 429 (18% of all properties)
--- Properties at risk in 2050: 872 (36% of all properties)

Five of the 10 most costly hurricanes in U.S. history hit North Carolina, where a flood occurs every seven-and-a-half days on average. Between 1960 and 2008, the population living in coastal areas grew by nearly half-a-million people鈥攁n increase of more than 100%鈥攂ut flood hazards in the state are by no means limited to the coast. Two-thousand five-hundred miles of road, 1.3 million acres of land, and $8 billion worth of property are in harm鈥檚 way.

32 / 48
Guy RD // Shutterstock

North Dakota

- Most properties at risk: West Fargo (5,248 properties at risk; 41% of all properties)
- Highest share of properties at risk: West Fargo (41% of all properties; 5,248 properties at risk)
- Highest projected increase: Mandan
--- Properties at risk in 2020: 1,146 (14% of all properties)
--- Properties at risk in 2050: 1,253 (15% of all properties)

Climatologists look to the amount of rain North Dakota receives in the fall as a key predictor of the state鈥檚 vulnerability to flooding in the spring鈥攚hen the ground there is saturated in the fall, water has nowhere to go when it rains when winter passes. These conditions led to , when the Red River crested at an unprecedented 40.84 feet. A decade later, the saturating autumn rains came again in October 2019, when the as the Red River Valley was once again at historically-high levels.

33 / 48
photo.ua // Shutterstock

Ohio

- Most properties at risk: Cincinnati (21,236 properties at risk; 13% of all properties)
- Highest share of properties at risk: Gallipolis (87% of all properties; 2,585 properties at risk)
- Highest projected increase: Delhi Hills
--- Properties at risk in 2020: 120 (5% of all properties)
--- Properties at risk in 2050: 148 (7% of all properties)

A recently confirmed that FEMA鈥檚 official flood map underestimated the number of Ohio鈥檚 at-risk properties by half鈥攖he federal government zoned fewer than a quarter-million homes and businesses as being vulnerable to flooding, when the real number is more like a half-million.

34 / 48
Nick Fox // Shutterstock

Oklahoma

- Most properties at risk: Tulsa (21,727 properties at risk; 14% of all properties)
- Highest share of properties at risk: Copeland (40% of all properties; 818 properties at risk)
- Highest projected increase: Pawhuska
--- Properties at risk in 2020: 612 (22% of all properties)
--- Properties at risk in 2050: 637 (23% of all properties)

2019 was one of the worst flood years in history across many states鈥攂ut few were hit harder than Arkansas, where an extended sequence of drenching rainfall caused . Areas around the state鈥檚 over-extended levee system were proactively evacuated as the Arkansas River rose to record levels鈥攐fficials were eventually forced to release millions of gallons of water from the up-river Keystone dam. It was the worst flooding since at least the mid-1980s, and among the worst in Oklahoma history.

35 / 48
brian legate // Shutterstock

Oregon

- Most properties at risk: Portland (45,951 properties at risk; 20% of all properties)
- Highest share of properties at risk: Milton-Freewater (90% of all properties; 2,176 properties at risk)
- Highest projected increase: Astoria
--- Properties at risk in 2020: 247 (4% of all properties)
--- Properties at risk in 2050: 482 (8% of all properties)

The First Street Foundation, whose modeling found FEMA's flood mapping to have overestimated the risk to New Jersey, is the polar opposite鈥攆ew states had more at-risk properties left off of federal maps. In fact, the First Street Foundation concluded that 268,020 Oregon properties meet mandatory-insurance status, not the 97,918 zoned by FEMA鈥攖hat's underreporting of nearly 174%, which means many Oregonians are woefully unprepared.

36 / 48
alexsf.gr // Shutterstock

Pennsylvania

- Most properties at risk: Philadelphia (63,378 properties at risk; 10% of all properties)
- Highest share of properties at risk: Kingston (98% of all properties; 4,869 properties at risk)
- Highest projected increase: Folcroft
--- Properties at risk in 2020: 99 (4% of all properties)
--- Properties at risk in 2050: 154 (6% of all properties)

In western , rainfall and snowmelt are the prime causes of flooding around the Pittsburgh region. To the east near Philadelphia, it鈥檚 high-tide flooding, storm surges, and riverine flooding from tropical storms and hurricanes.

37 / 48
ESB Professional // Shutterstock

Rhode Island

- Most properties at risk: Providence (5,176 properties at risk; 13% of all properties)
- Highest share of properties at risk: Charlestown (27% of all properties; 570 properties at risk)
- Highest projected increase: Tiverton
--- Properties at risk in 2020: 105 (3% of all properties)
--- Properties at risk in 2050: 172 (5% of all properties)

Flooding is a year-round problem in tiny , but the causes are usually determined by the season. Thunderstorms cause localized flooding in the spring and fall, while hurricanes and tropical storms are the culprits in the late summer. Most winter floods can be traced to ice jams and snowmelt.

38 / 48
jdross75 // Shutterstock

South Carolina

- Most properties at risk: Charleston (29,469 properties at risk; 59% of all properties)
- Highest share of properties at risk: Seabrook Island (97% of all properties; 2,296 properties at risk)
- Highest projected increase: Bluffton
--- Properties at risk in 2020: 2,703 (20% of all properties)
--- Properties at risk in 2050: 7,600 (57% of all properties)

Unlike Rhode Island where flooding is inspired by the seasons, is more like Pennsylvania in that geography determines the cause. Heavy rain, storm surges, and tides cause flooding in the Charleston region, which is situated at a low elevation close to the Atlantic. In the mountainous west, river flooding and gravity are the usual suspects.

39 / 48
Sopotnicki // Shutterstock

South Dakota

- Most properties at risk: Rapid City (4,594 properties at risk; 18% of all properties)
- Highest share of properties at risk: Sturgis (40% of all properties; 1,267 properties at risk)
- Highest projected increase: Aberdeen
--- Properties at risk in 2020: 1,048 (10% of all properties)
--- Properties at risk in 2050: 1,092 (11% of all properties)

Several of 鈥攊ncluding Rapid City, Pierre, and Sioux Falls鈥攁re situated near the state鈥檚 famous large rivers, including the Rapid Creek, Missouri, and Big Sioux rivers. When they flood, which they regularly do, those population centers flood right along with them.

40 / 48
f11photo // Shutterstock

Tennessee

- Most properties at risk: Nashville-Davidson (33,153 properties at risk; 13% of all properties)
- Highest share of properties at risk: Chattanooga (42% of all properties; 31,575 properties at risk)
- Highest projected increase: Lakewood Park
--- Properties at risk in 2020: 201 (6% of all properties)
--- Properties at risk in 2050: 235 (7% of all properties)

For well over 100 years, Tennessee has grappled with . In 1933, the Tennessee Valley Authority (TVA) was created to manage that very issue. Its management efforts have prevented significant flood damage each year since, including the in the first quarter of 2020 alone. A higher rate of heavy rain events each year continues to pose serious flood risks throughout the state.

Editor's note: A previous version of this slide neglected to include successful flood-prevention efforts by the TVA.

41 / 48
Brandon Seidel // Shutterstock

Texas

- Most properties at risk: Houston (186,481 properties at risk; 32% of all properties)
- Highest share of properties at risk: Groves (100% of all properties; 7,074 properties at risk)
- Highest projected increase: Ingleside
--- Properties at risk in 2020: 629 (17% of all properties)
--- Properties at risk in 2050: 1,852 (49% of all properties)

In West Texas by El Paso, frequent heavy rains swell the Rio Grande and cause riverine flooding. In the eastern portion of the state, proximity to the Gulf of Mexico makes the from tropical storms and hurricanes. Across Texas, huge population booms have degraded natural absorption features and increased urban runoff.

42 / 48
Checubus // Shutterstock

Utah

- Most properties at risk: Salt Lake City (15,584 properties at risk; 23% of all properties)
- Highest share of properties at risk: Parowan (51% of all properties; 1,139 properties at risk)
- Highest projected increase: Clearfield
--- Properties at risk in 2020: 11 (0% of all properties)
--- Properties at risk in 2050: 46 (1% of all properties)

, summer storms frequently overflow rivers like the Santa Clara and Virgin. In the Salt Lake Valley, snowmelt forces the Jordan River to flood the region. In response, the state built the Surplus Canal, which diverts runoff and mitigates flood damage.

43 / 48
James Kirkikis // Shutterstock

Vermont

- Most properties at risk: Bennington (1,292 properties at risk; 43% of all properties)
- Highest share of properties at risk: Bennington (43% of all properties; 1,292 properties at risk)
- Highest projected increase: Rutland
--- Properties at risk in 2020: 768 (13% of all properties)
--- Properties at risk in 2050: 813 (14% of all properties)

In Vermont鈥檚 Lake Champlain region, residents are from lake overflows caused by snowmelt and rain. Snowmelt is also the chief cause of flooding in the south of the state, although ice jams play a role there sometimes, as well.

44 / 48
Jay Yuan // Shutterstock

Virginia

- Most properties at risk: Virginia Beach (28,943 properties at risk; 20% of all properties)
- Highest share of properties at risk: Chincoteague (80% of all properties; 4,514 properties at risk)
- Highest projected increase: Norfolk
--- Properties at risk in 2020: 18,042 (27% of all properties)
--- Properties at risk in 2050: 54,054 (80% of all properties)

In Virginia鈥檚 inland, are caused by heavy rains that overflow rivers, particularly the James River. In the east, hurricanes, rising sea levels, and storm surges cause most of the damage, all of which are exacerbated by beach erosion.

45 / 48
Andriy Blokhin // Shutterstock

Washington

- Most properties at risk: Seattle (13,977 properties at risk; 8% of all properties)
- Highest share of properties at risk: Toppenish (100% of all properties; 2,438 properties at risk)
- Highest projected increase: Indianola
--- Properties at risk in 2020: 110 (5% of all properties)
--- Properties at risk in 2050: 179 (8% of all properties)

, winter storms cause most of the flooding in the cold months, while snowmelt is responsible for most annual flooding in the spring and summer. The state maintains nearly 90,000 levees to mitigate the damage.

46 / 48
Jerry Pennington // Shutterstock

West Virginia

- Most properties at risk: Charleston (12,767 properties at risk; 44% of all properties)
- Highest share of properties at risk: Dunbar (76% of all properties; 3,090 properties at risk)
- Highest projected increase: Huntington
--- Properties at risk in 2020: 3,724 (15% of all properties)
--- Properties at risk in 2050: 4,402 (18% of all properties)

maintains a network of more than 9,000 dams and nearly 25,000 levees. The natural hazard they鈥檙e mainly tasked with managing is riverine flooding caused by frequent and heavy rainfall. The Ohio and Kanawha rivers are most vulnerable.

47 / 48
Tony Savino // Shutterstock

Wisconsin

- Most properties at risk: Milwaukee (12,203 properties at risk; 8% of all properties)
- Highest share of properties at risk: Oconto (58% of all properties; 1,351 properties at risk)
- Highest projected increase: Milton
--- Properties at risk in 2020: 205 (9% of all properties)
--- Properties at risk in 2050: 252 (11% of all properties)

, officials in Madison reinforced the shoreline and upgraded their stormwater systems to combat flash floods and lake overflows. Natural storage and channel improvements were Milwaukee鈥檚 main defenses against frequent flooding from snowmelt and heavy rainfall.

48 / 48
Thomas Solberg // Shutterstock

Wyoming

- Most properties at risk: Casper (4,718 properties at risk; 19% of all properties)
- Highest share of properties at risk: Jackson (34% of all properties; 1,812 properties at risk)
- Highest projected increase: Worland
--- Properties at risk in 2020: 526 (19% of all properties)
--- Properties at risk in 2050: 639 (23% of all properties)

Violent thunderstorms are common around most of , many of which are accompanied by heavy rainfall. That, combined with the state鈥檚 unique geography and geology, make flash flooding the biggest flood threat in the state by far.

Trending Now