Hospitals across the country are on the verge of overflowing with nearly 700 hospitals at over 90% inpatient capacity, according to . Meanwhile, 750 hospitals have exceeded 90% capacity in their intensive care units, where patients in critical condition are treated.
These numbers come as a third surge of COVID-19 outbreaks rages in nearly every state. The U.S. passed 100,000 patients hospitalized with COVID-19 on Dec. 2, a number about two-thirds higher than patient counts during spring and summer outbreaks which each peaked at around 60,000 patients nationwide. As of Dec. 14, more than 110,000 patients are hospitalized with COVID-19, .
As of Dec. 13, 19% of hospitals in the nation were facing critical staffing shortages, , while 24% anticipated such a shortage within the next week. In North Dakota, these figures rise to 40% of hospitals in the state. When , it becomes challenging for doctors and nurses to provide COVID-19 patients with the attention care they need and can lead to further loss of life.
The new HHS dataset of these grim national statistics that includes counts of patients and hospital beds at the individual hospital level for more than 4,000 facilities across the country. These counts are reported by hospitals nearly every day, either sent directly to the HHS or sent to state public health departments and hospital networks that aggregate the data. Ā鶹Ō““ used these counts to calculate three values for each hospital:
- Patients hospitalized with COVID-19: share of COVID-19 patients compared to all patients in the hospital
- Inpatient bed occupancy: how many standard care beds in the hospital are currently filled with patients
- ICU bed occupancy: how many intensive care beds are currently filled with patients
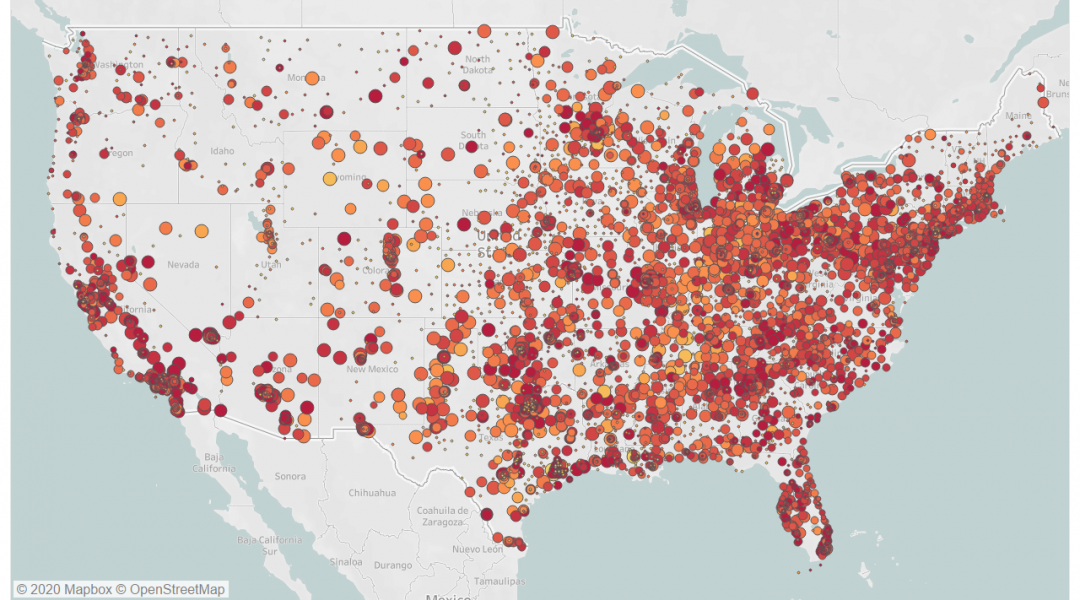
You can zoom in to look at your neighborhood hospital on the interactive map or compare hospitals in your state using the interactive table below; both visualizations were produced by Ā鶹Ō““. These figures represent the week of Dec. 11 to Dec. 17, the most recent week of data available.
Ā鶹Ō““ has also mapped out how COVID-19 is impacting hospitals ; these data are as of Dec. 21.
For more charts, including county-level maps, see .
Please note that counts of patients and beds lower than four are suppressed in the dataset. This causes occupancy figures to be unavailable for some smaller hospitals. ICU occupancy figures are also unavailable for many hospitals for this reason. Ā鶹Ō““ consulted the and developed by data journalists and healthcare researchers for technical information on the dataset.
Editor's note: The visualizations in this story were updated on December 22 to reflect the most recent data available.