States where food stamps are used the most
States where food stamps are used the most
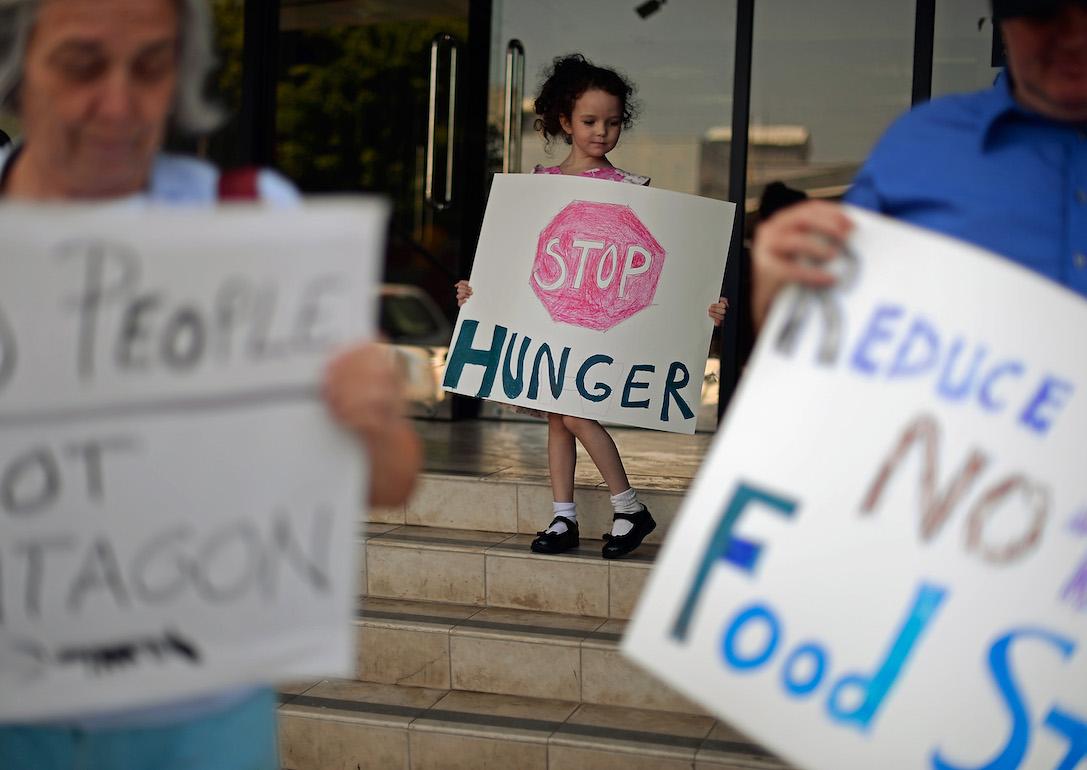
Prior to the coronavirus pandemic, affected more than 37 million people, among them 11 million children. That number, though staggering, represented the lowest point of food insecurity in the country in almost 90 years. Against the backdrop of the ongoing pandemic, national hunger-relief organization Feeding America expected more than during 2021. This demand puts additional strain on already-strapped food pantries, hunger-relief organizations, and drives significant need for increases in the country's Supplemental Nutrition Assistance Program (SNAP, also known previously as food stamps).
Â鶹Դ´ compiled a list of the states where food stamps are used the most using SNAP data released July 10, 2020, by the . The number of households and the poverty rate are current as of 2019 data from the . States are ranked by the percent of households that received food stamps in April 2020. Additional information came from sources like the , Feeding America, and state websites and local food banks.
Keep reading to find out where your state ranks in terms of food stamp usage, and what is being done to curb hunger and food insecurity in your area.
You may also like:
#51. Wyoming
- Percent of households receiving food stamps: 5.0%
- Total households receiving food stamps: 11,703
- Average benefit per household: $256 (#11 highest among all states)
Wyoming's department of family services works with the University of Wyoming's extension office to offer a . also help families in need.
#50. Utah
- Percent of households receiving food stamps: 7.0%
- Total households receiving food stamps: 72,173
- Average benefit per household: $268 (#4 highest among all states)
Utah Food Bank distributes about meals a year. The state has a relatively low poverty rate, but does have .
#49. North Dakota
- Percent of households receiving food stamps: 7.2%
- Total households receiving food stamps: 23,329
- Average benefit per household: $242 (#21 highest among all states)
An abundance of in North Dakota accept food stamp benefits, bridging the gap for those in need who seek nutritious diets. There's a debate in the state on whether should be banned under benefits.
#48. New Hampshire
- Percent of households receiving food stamps: 7.3%
- Total households receiving food stamps: 39,760
- Average benefit per household: $194 (#51 highest among all states)
Food insecurity in New Hampshire is less than the national average. The state uses a program that provides an additional 50% off certain fresh fruits and vegetables.
#47. Kansas
- Percent of households receiving food stamps: 8.2%
- Total households receiving food stamps: 92,922
- Average benefit per household: $231 (#32 highest among all states)
Some Kansans are pushing to create a break on the state's for low-income residents. The state's 6.5% sales tax on food can be coupled with local sales taxes in some areas to create a tax of more than 10% for groceries.
You may also like:
#46. Minnesota
- Percent of households receiving food stamps: 9.3%
- Total households receiving food stamps: 207,153
- Average benefit per household: $203 (#49 highest among all states)
Almost 39% of families receiving food stamp assistance in Minnesota have children. , exacerbating hardship for many families.
#45. Nebraska
- Percent of households receiving food stamps: 9.6%
- Total households receiving food stamps: 73,927
- Average benefit per household: $257 (#10 highest among all states)
Almost one in eight Nebraska residents (including one in six children) struggle with hunger, . Nebraska has a program similar to New Hampshire's.
#44. Indiana
- Percent of households receiving food stamps: 9.8%
- Total households receiving food stamps: 254,030
- Average benefit per household: $266 (#6 highest among all states)
Indiana has a robust system, but residents still struggles with hunger. In 2020, became eligible for food stamps in Indiana.
#43. Colorado
- Percent of households receiving food stamps: 10.1%
- Total households receiving food stamps: 224,890
- Average benefit per household: $236 (#28 highest among all states)
More than half a million Colorado residents struggle with hunger, according to . About a quarter of a million households in the state received SNAP benefits in 2020, with an average monthly benefit that year of $343.
#42. Idaho
- Percent of households receiving food stamps: 10.1%
- Total households receiving food stamps: 66,547
- Average benefit per household: $243 (#20 highest among all states)
Idaho has almost food-insecure residents, more than 57,000 of whom are children. Like many states, during the pandemic those receiving food stamps in Idaho were able to make certain grocery store purchases online for the first time.
You may also like:
#41. New Jersey
- Percent of households receiving food stamps: 10.7%
- Total households receiving food stamps: 350,174
- Average benefit per household: $227 (#34 highest among all states)
New Jersey's dense population and high can contribute to the number of households receiving food stamps. In April 2021, New Jersey's Department of Human Services announced for 231,000 households in the state.
#40. South Dakota
- Percent of households receiving food stamps: 10.7%
- Total households receiving food stamps: 37,849
- Average benefit per household: $267 (#5 highest among all states)
Poverty rates in South Dakota were in decline prior to COVID-19, however, census data show that the indigenous population in the state has a poverty rate almost double that of the next highest race/ethnic group. Proposed federal food stamp changes may particularly affect .
#39. Virginia
- Percent of households receiving food stamps: 10.7%
- Total households receiving food stamps: 342,330
- Average benefit per household: $241 (#23 highest among all states)
Virginia's is well above the national average, but the gap between rich and poor in the state keeps growing. The U.S. Census Bureau uses the Gini index to measure inequality in income, and Virginia's Gini index rose from 2017 to 2018. Virginia in 2019 received a for mistakes in processing food stamp applications.
#38. Iowa
- Percent of households receiving food stamps: 11.9%
- Total households receiving food stamps: 153,470
- Average benefit per household: $230 (#33 highest among all states)
The Iowa caucuses put a spotlight on issues like poverty in the Hawkeye State. For example, have a poverty rate that's almost double the state average. However, some Iowa constituents are at odds with how the state should disperse aid to lessen such gaps.
#37. Montana
- Percent of households receiving food stamps: 12.1%
- Total households receiving food stamps: 52,998
- Average benefit per household: $232 (#30 highest among all states)
Prior to the pandemic, which exacerbated food insecurity throughout the U.S., more than 110,000 Montanans were challenged with hunger. In 2020, as the coronavirus spread throughout the world, rose 36% over the previous year.
You may also like:
#36. Missouri
- Percent of households receiving food stamps: 13.1%
- Total households receiving food stamps: 321,512
- Average benefit per household: $251 (#14 highest among all states)
Missouri's poverty rate continually stays above the national average. The group identifies nutrition and health as two of five key factors affecting poverty in the state.
#35. Wisconsin
- Percent of households receiving food stamps: 13.1%
- Total households receiving food stamps: 312,579
- Average benefit per household: $205 (#48 highest among all states)
The University of Wisconsin's Institute for Research on Poverty found the effect food stamps have in lowering poverty rates are declining. Meanwhile, the Wisconsin Policy Forum released a report in September 2020 showing a , attributed to the pandemic.
#34. Arkansas
- Percent of households receiving food stamps: 13.5%
- Total households receiving food stamps: 156,621
- Average benefit per household: $236 (#27 highest among all states)
Reports find that Arkansas is , with problems concentrated in the central and southern sectors of the state. Residents receiving SNAP benefits on average are unable to meet their food needs with what is distributed each month.
#33. Arizona
- Percent of households receiving food stamps: 13.6%
- Total households receiving food stamps: 362,808
- Average benefit per household: $254 (#12 highest among all states)
Roughly 13.5% of , according to census figures. The nearly 100,000 represent less than half of the eligible people in that age group.
#32. Kentucky
- Percent of households receiving food stamps: 13.8%
- Total households receiving food stamps: 241,584
- Average benefit per household: $250 (#16 highest among all states)
Kentucky was ranked in 37th place out of all 50 states for its . About face food insecurity.
#31. California
- Percent of households receiving food stamps: 13.9%
- Total households receiving food stamps: 1,824,382
- Average benefit per household: $263 (#7 highest among all states)
The CalFresh Restaurant Meals Program gives those 60 and older, those experiencing homelessness, and those with disabilities to use their food benefits at participating restaurants. Those receiving food stamp benefits in the state are in what is widely considered to be a complicated process that creates a barrier between those in need and the benefits they are eligible for.
#30. South Carolina
- Percent of households receiving food stamps: 13.9%
- Total households receiving food stamps: 275,630
- Average benefit per household: $250 (#15 highest among all states)
South Carolina ranks in the for food insecurity (13.9%). There has been some criticism that poverty in South Carolina is particularly hard on .
#29. Texas
- Percent of households receiving food stamps: 14.3%
- Total households receiving food stamps: 1,430,437
- Average benefit per household: $269 (#3 highest among all states)
Texas has a poverty rate, among th highest in the country. As in other states, there is a perennial debate in Texas over whether .
#28. Ohio
- Percent of households receiving food stamps: 14.5%
- Total households receiving food stamps: 688,024
- Average benefit per household: $242 (#22 highest among all states)
Poverty disproportionately affects . State legislators and social service advocates have been debating the merits of and Medicaid benefits.
#27. Maine
- Percent of households receiving food stamps: 14.8%
- Total households receiving food stamps: 85,139
- Average benefit per household: $199 (#50 highest among all states)
In Maine, show a much higher rate of residents living below the poverty line. However, these same areas also produced some of the highest median incomes.
#26. Maryland
- Percent of households receiving food stamps: 14.9%
- Total households receiving food stamps: 332,146
- Average benefit per household: $213 (#42 highest among all states)
Maryland has a low poverty rate and food insecurity rate despite it being an expensive state to live in. On average, goods and services cost more in Maryland than the rest of the U.S.
#25. Vermont
- Percent of households receiving food stamps: 15.0%
- Total households receiving food stamps: 39,351
- Average benefit per household: $209 (#44 highest among all states)
Vermont has a higher-than-average median household income and one of the lowest food insecurity rates in the country. But during the pandemic in 2020, overwhelmed service centers throughout the state. The growing emergency led multiple other charities to step up and offer help.
#24. North Carolina
- Percent of households receiving food stamps: 15.3%
- Total households receiving food stamps: 619,367
- Average benefit per household: $232 (#29 highest among all states)
The need for food access has spiked in North Carolina during the coronavirus pandemic, with nearly 20% of all residents facing food insecurity in 2020 according to estimates. have put additional strain on food-insecure households.
#23. Connecticut
- Percent of households receiving food stamps: 15.4%
- Total households receiving food stamps: 212,331
- Average benefit per household: $226 (#35 highest among all states)
have remained, even as vaccination rates rise throughout the state and country. This is certainly due in part to the fact that low-wage workers in Connecticut were still, as of April 2021, .
#22. Alaska
- Percent of households receiving food stamps: 15.6%
- Total households receiving food stamps: 39,433
- Average benefit per household: $372 (#2 highest among all states)
of Alaskan children live in poverty. Alaskan natives and American Indians are the most affected, and a 2018 report stated that 20% of Alaskan children are food insecure.
#21. Michigan
- Percent of households receiving food stamps: 15.8%
- Total households receiving food stamps: 628,885
- Average benefit per household: $223 (#36 highest among all states)
Michiga has faced some difficult problems in recent years. More than 45,000 residents signed up to receive the settlement from the that began in 2014 and disproportionately affected low-income residents. Throughout the state, children younger than 5 have more than double the poverty rate of senior citizens.
#20. Tennessee
- Percent of households receiving food stamps: 16.1%
- Total households receiving food stamps: 428,677
- Average benefit per household: $248 (#17 highest among all states)
As the country began its , Tennessee's jobless rate dropped lower than the national average. But the state still has the eighth-highest rate of food security (12.6%) and the fourth-highest rate of housing insecurity.
#19. Washington
- Percent of households receiving food stamps: 16.3%
- Total households receiving food stamps: 479,207
- Average benefit per household: $205 (#46 highest among all states)
Washington has a low poverty rate and doles out some of the highest average food stamp benefits in the country. Still, some academics have called the poverty levels amid growing wealth in Seattle as ""
#18. Delaware
- Percent of households receiving food stamps: 16.7%
- Total households receiving food stamps: 62,920
- Average benefit per household: $231 (#31 highest among all states)
Programs like , a mobile van that helps prisoners get back on their feet by providing services like food and assistance with food stamp applications, are working to decrease high poverty rates in Delaware. Efforts were underway in April 2021 to mitigate the additional , including the extension and expansion of SNAP benefits.
#17. Georgia
- Percent of households receiving food stamps: 16.8%
- Total households receiving food stamps: 647,278
- Average benefit per household: $261 (#9 highest among all states)
Georgia has one of the highest poverty rates in the country. The distributed more than 578 million pounds of food in fiscal year 2019-2020.
#16. Massachusetts
- Percent of households receiving food stamps: 16.8%
- Total households receiving food stamps: 445,664
- Average benefit per household: $207 (#45 highest among all states)
Massachusetts has one of the lowest average food stamp benefits in the country. The MetroWest region of Massachusetts has struggled with rising homeless rates and children living in poverty, and research suggests that living in poverty can affect .
#15. Hawaii
- Percent of households receiving food stamps: 17.2%
- Total households receiving food stamps: 79,929
- Average benefit per household: $459 (#1 highest among all states)
Hawaii gives out the highest average food stamps benefit in the U.S. and has an extremely low food insecurity rate. The coronavirus pandemic was particularly economically devastating to Hawaii, which depends heavily on its robust tourism industry. During the pandemic, .
#14. Oklahoma
- Percent of households receiving food stamps: 17.7%
- Total households receiving food stamps: 264,417
- Average benefit per household: $253 (#13 highest among all states)
reports that hunger costs the state "$1.4 billion each year through increased illness and decreased academic achievement." While 45% of eligible schools throughout the U.S. provide no-cost meals to all students, just 15% of Oklahoma schools offer such a service.
#13. Illinois
- Percent of households receiving food stamps: 17.8%
- Total households receiving food stamps: 864,878
- Average benefit per household: $248 (#18 highest among all states)
Roughly Illinois residents live in poverty, and children struggle with hunger. Nonprofits like and work to close the gap. Illinois joined a in 2020 against federal cutbacks to food stamp programs.
#12. Alabama
- Percent of households receiving food stamps: 17.9%
- Total households receiving food stamps: 339,982
- Average benefit per household: $247 (#19 highest among all states)
In Alabama, are hit particularly hard by food insecurity. aims to reduce poverty throughout the state.
You may also like:
#11. Pennsylvania
- Percent of households receiving food stamps: 18.3%
- Total households receiving food stamps: 938,729
- Average benefit per household: $218 (#39 highest among all states)
More than of households in Pennsylvania receiving food stamp benefits have children. Overall, Pennsylvania's food insecurity rate is right in the middle nationally.
#10. Mississippi
- Percent of households receiving food stamps: 18.9%
- Total households receiving food stamps: 207,566
- Average benefit per household: $237 (#26 highest among all states)
For years, Mississippi has had the nation's . The disparity in in Mississippi is striking, with roughly three times as many Black children in need. The state in 2019 made drug felons .
#9. Florida
- Percent of households receiving food stamps: 19.0%
- Total households receiving food stamps: 1,499,980
- Average benefit per household: $216 (#41 highest among all states)
More than half of Floridian children live below or approaching the poverty line. While 66% of children enrolled in public school qualify for free or discounted school lunches, the state (and the country in general) do not allow aid programs like SNAP to cover .
#8. Nevada
- Percent of households receiving food stamps: 19.3%
- Total households receiving food stamps: 221,242
- Average benefit per household: $220 (#38 highest among all states)
Nevada is among the West's leading suppliers of food stamps and has a food insecurity rate. More than 10% of households reportedly use high-cost, high-risk forms of credit to make ends meet.
#7. New York
- Percent of households receiving food stamps: 20.3%
- Total households receiving food stamps: 1,514,547
- Average benefit per household: $237 (#25 highest among all states)
Organizations like attempt to combat food insecurity issues in and more in New York City. In 2018, of New York City's food pantries and kitchens had to turn people away, reduce portions, or limit operating hours. The city's poverty rate approached ahead of the pandemic.
You may also like:
#6. Oregon
- Percent of households receiving food stamps: 21.2%
- Total households receiving food stamps: 349,537
- Average benefit per household: $210 (#43 highest among all states)
In Oregon, about 553,000 resident Oregonians are food insecure, with almost 200,000 of those being children. The operates 21 regional banks and 1,200 food assistance sites.
#5. Louisiana
- Percent of households receiving food stamps: 21.2%
- Total households receiving food stamps: 369,236
- Average benefit per household: $262 (#8 highest among all states)
Almost of Louisiana households skip meals because they lack money to buy food. The state has among the highest rates of seniors at risk of hunger in the country. Louisiana is also one of the slowest growing states for personal income and has one of the nation's .
#4. West Virginia
- Percent of households receiving food stamps: 21.8%
- Total households receiving food stamps: 158,856
- Average benefit per household: $205 (#47 highest among all states)
West Virginia implemented tougher work requirements for food stamps, but The New York Times that it did not lead to increased levels of employment. More than of West Virginia households are food insecure.
#3. District of Columbia
- Percent of households receiving food stamps: 22.0%
- Total households receiving food stamps: 64,035
- Average benefit per household: $218 (#40 highest among all states)
in the D.C. area are especially affected by food insecurity. Organizations like work to combat the problem.
#2. Rhode Island
- Percent of households receiving food stamps: 22.2%
- Total households receiving food stamps: 90,212
- Average benefit per household: $222 (#37 highest among all states)
Rhode Island has a thriving economy, but amid rising costs of living. In recent years, Rhode Island's children live in higher rates of poverty compared to the national average. Dozens of help reduce the number of hungry people in Rhode Island.
#1. New Mexico
- Percent of households receiving food stamps: 27.6%
- Total households receiving food stamps: 218,674
- Average benefit per household: $238 (#24 highest among all states)
New Mexico has a of 15.1%. A high rate of suffer food insecurity.


