How spending on public safety and policing has changed over the last 40 years
How spending on public safety and policing has changed over the last 40 years
Rates of violent crime are significantly lower today than they were just three decades ago, though many Americans . And still, police spending continues to go up despite downward trends in crime.
at a rate of 758 incidents per 100,000 people, according to FBI data. Today, the rate is roughly half of that, at 398 incidents per 100,000 people.
Experts and researchers have not reached a consensus on what drove violent crime rates down so dramatically since 1991. Some speculate that low unemployment and a generally favorable economic climate disincentivized violent crime. Others cite a reduction in alcohol consumption—. An increase in police personnel and stricter policing tactics have also been evaluated but proved to be only a modest influence, accounting for no more than 10% of the crime decline.
Many studies have attempted to answer whether crime can be reduced by increasing the number of police officers on patrol. While results are split, generally, there is not a strong significant relationship between the two. But recent research from economist Morgan Williams shows the power of deterrence cannot be wholly discounted.
Using data from the FBI and other public sources for 242 cities between 1981 and 2018, Williams and his colleagues were able to quantify the value, in lives saved, of every new police officer added to a force. Every new officer . Therefore, the average city would need to hire between 10 and 17 new police officers—costing $1.3 to $2.2 million—to save one life a year. This is, perhaps surprisingly, a good return on investment, considering the according to the Environmental Protection Agency. Williams also found that an increase in police leads to a reduction in other violent crimes, as well as violent crime arrests, suggesting that having a greater police presence can deter crime, not just lead to more incarceration.
Inflection points in recent history, particularly the death of George Floyd in 2020, have led to calls for police defunding and divestment. In many places nationwide, police are expected to fill the gaps where critical social services are inadequate—instead of investing in improved housing, more police are used to surveil disadvantaged neighborhoods or break up homeless encampments; and instead of investing in mental health and addiction resources, drug-related arrests are used as a temporary solution. Defunding police forces would mean reallocating some portion of police spending to these social services.
Â鶹Դ´ analyzed data from the to examine how city spending on public safety has changed between 1980 and 2020, and how police funding has evolved within that category. The data includes normalized per capita data in 2020 dollars. Read more about how the Fiscally Standardized Cities data —municipal, county, and city—to create an apples-to-apples comparison for city spending on public safety.
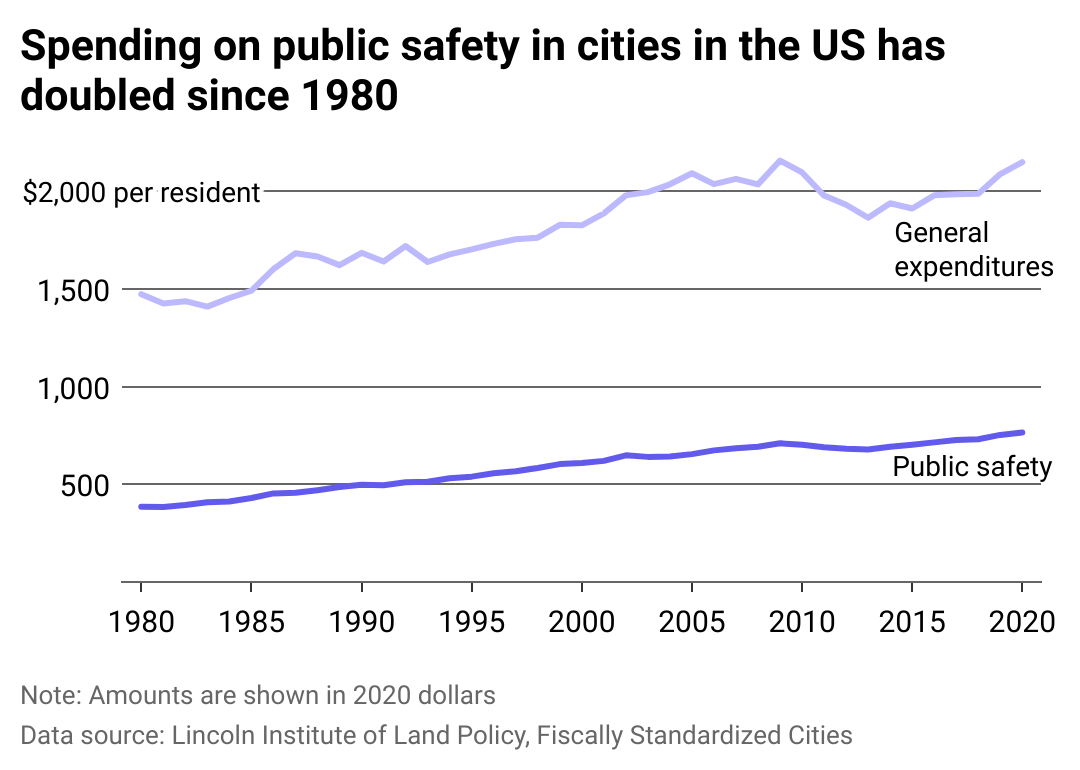
Spending on public safety in cities in the US has doubled since 1980
In the context of local governments, public safety broadly covers most roles and functions related to protecting the physical well-being of the general public—think police officers, firefighters, and emergency response teams, for example. Public safety spending—which falls under general expenditures in city budgets along with education, health, housing, and transportation—grew from $384 per capita in 1980 to $765 per capita in 2020. In 150 large U.S. cities, police spending—included in public safety—makes up a than housing.
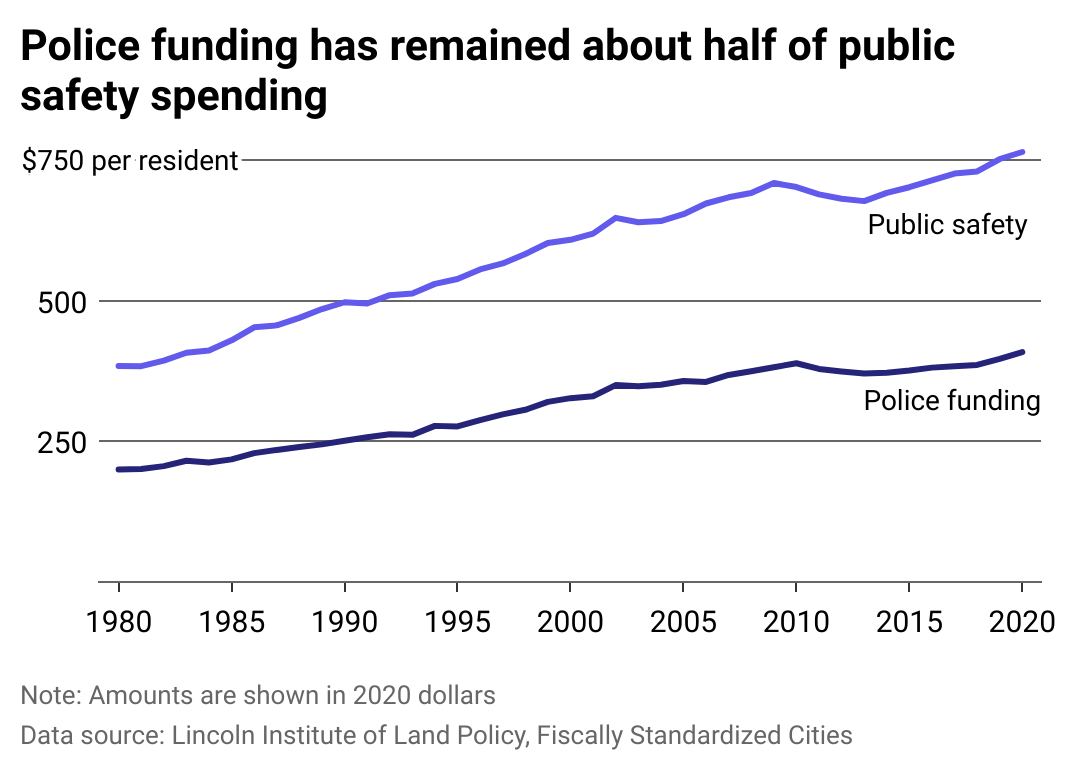
Police funding has remained about half of public safety budgets consistently for 40 years
The increase in police funding, despite cities generally growing safer, is likely driven by wage and force growth. The vast majority of police budgets—about 96%—are allocated to salaries and benefits. Over the last several decades, police salaries have grown modestly to accommodate for cost of living increases. The 2021 median salary for a police officer was just over $66,000, according to the Bureau of Labor Statistics. In 1978, for comparison, the or the equivalent of roughly $54,000 in 2021 dollars.
Police forces have also been , though the per capita rate is relatively unchanged. From 1990 to 1999, the number of , from 698,892 to 899,118. From 2000 to 2012, growth slowed but still increased by 3%. Police numbers eventually dipped in 2013, according to an analysis by the Brennan Center.
Police gear and training have become more advanced and, as a result, costlier over time. These capital expenditures, however, only make up a small fraction of police budgets.
The 1994 crime bill increased federal aid for policing, enabling cities to provide large amounts of police funding even when other budgets were constrained. The bill provided funding for 100,000 new local police officers and created the Department of Justice's Office of Community-Oriented Policing Services. Since its creation, COPS has provided in funding for departments to hire more law enforcement, update technology, and purchase new equipment.
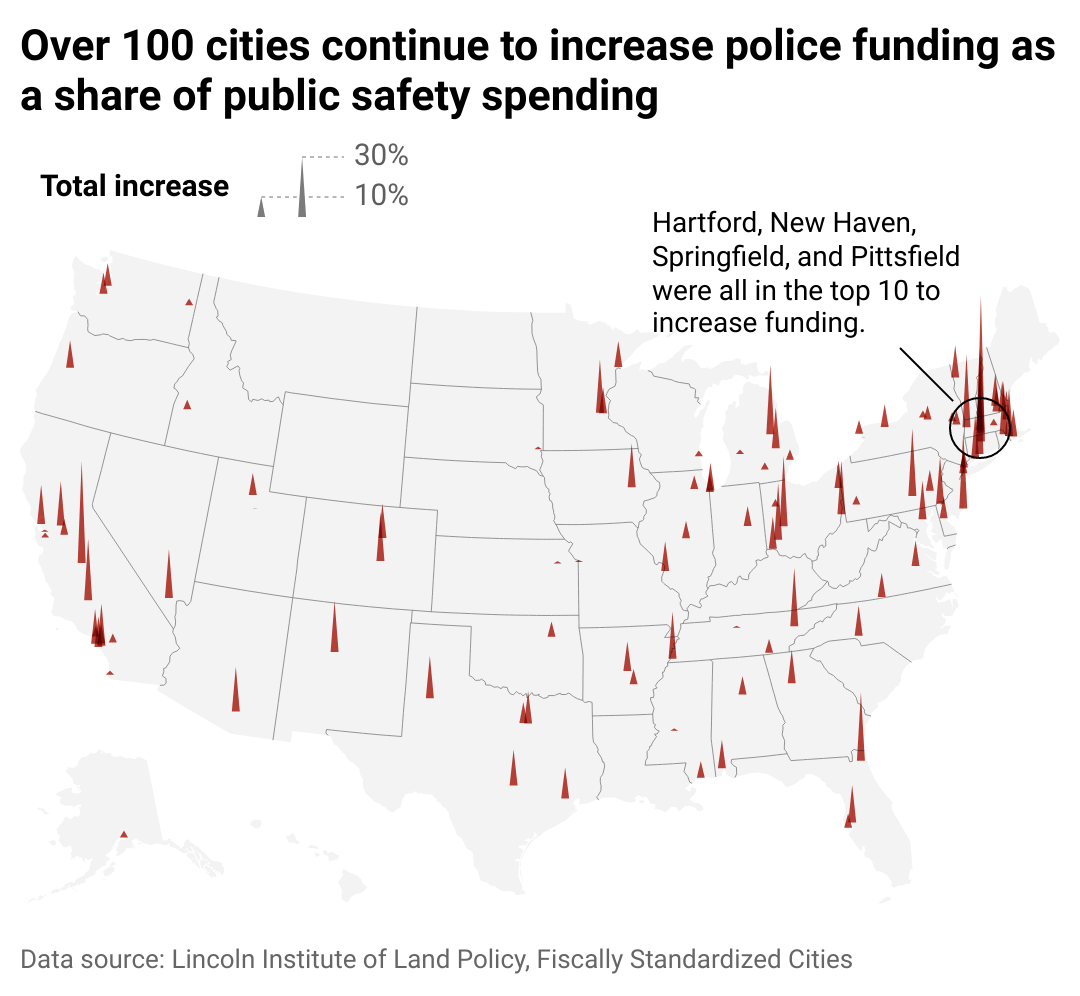
Even with ballooning public safety budgets, many cities allocate more money to the police
#1. Hartford, Connecticut: +34.9%
#2. New Haven, Connecticut: +25.3%
#3. Fresno, California: +24.3%
#4. Springfield, Massachusetts: +20.0%
#5. Atlantic City, New Jersey: +18.4%
#6. Pittsfield, Massachusetts: +17.5%
#7. Springfield, Ohio: +16.8%
#8. Bay City, Michigan: +16.5%
#9. Jacksonville, Florida: +16.3%
#10. Harrisburg, Pennsylvania: +16.1%
In many places where police spending increased, violent crime is also far above average, particularly in the Northeast. Statewide, Connecticut's violent crime rate has fallen dramatically since its peak in 1990. But the violent crime rates in —two of Connecticut's largest cities—are both nearly nine times higher than the .
Hartford has only increased spending on public safety from $479 to $592 per capita, but police spending in the city has nearly doubled, rising from $242 to $428 per capita. Similarly, Springfield—Massachusetts' third largest city behind Boston and Worcester—has a violent crime rate ; Pittsfield is more than double.
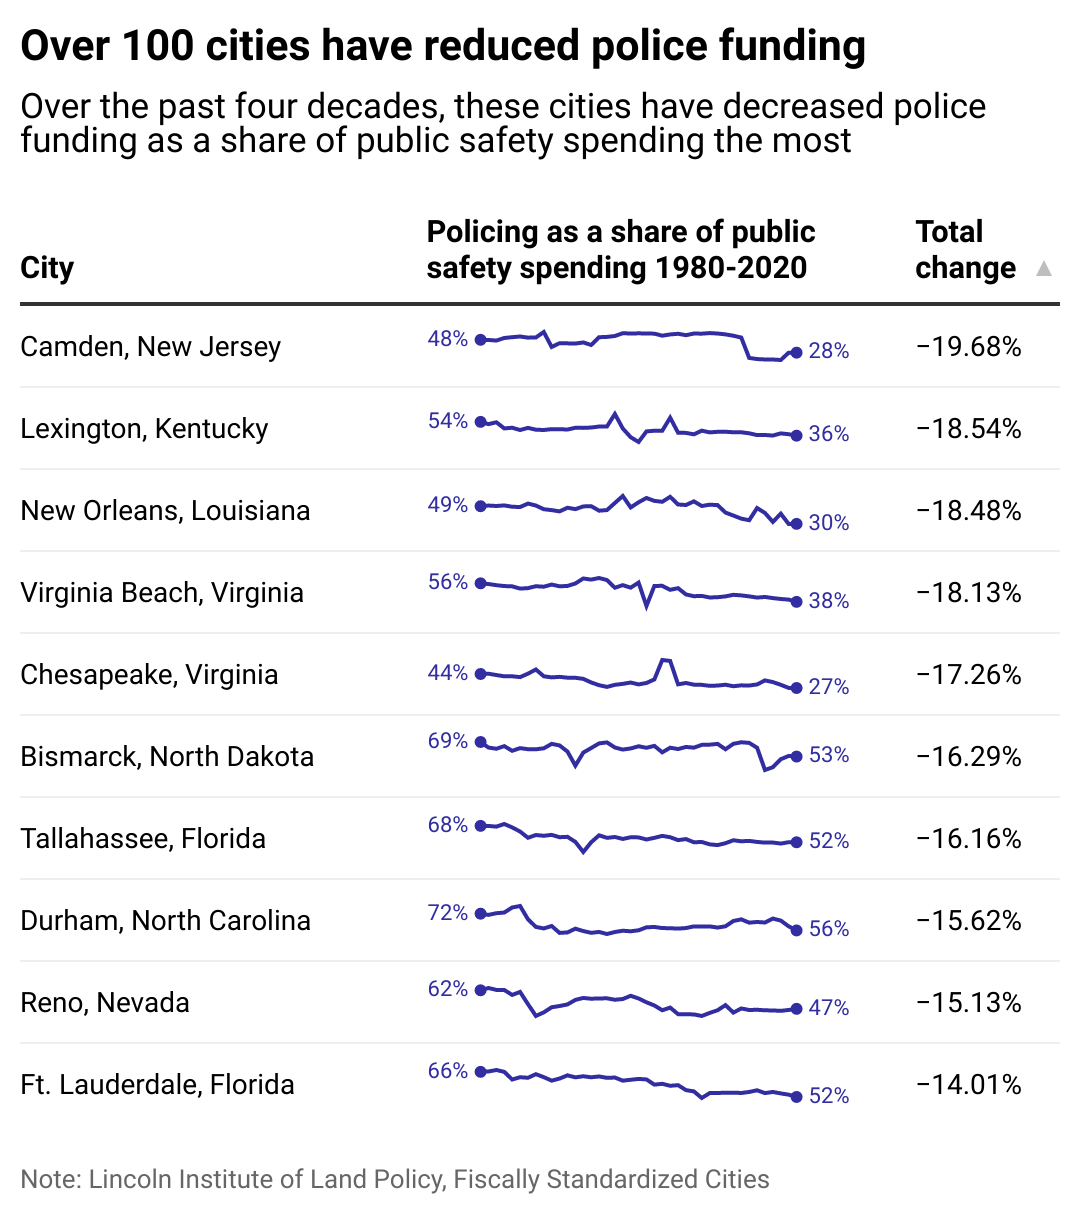
Some cities have reigned in police spending, while others have tightened overall public safety budgets
The causes of decreased police spending can vary from place to place. In some cases, it was the result of larger budgetary constraints . Following the impact of the Great Recession, state aid to Camden, New Jersey, was slashed in 2010, and roughly was laid off.
By 2012, Camden was ranked the most dangerous city in America, with a murder rate over 18 times the national average. This precipitated an impactful restructuring of its law enforcement. Camden eventually abolished its police force and moved to a regional model focused on community engagement. Violent crime from 2012 to 2019.
Data reporting by Sam Larson. Story editing by Brian Budzynski. Copy editing by Tim Bruns.


