Most expensive types of homeowner loss claims
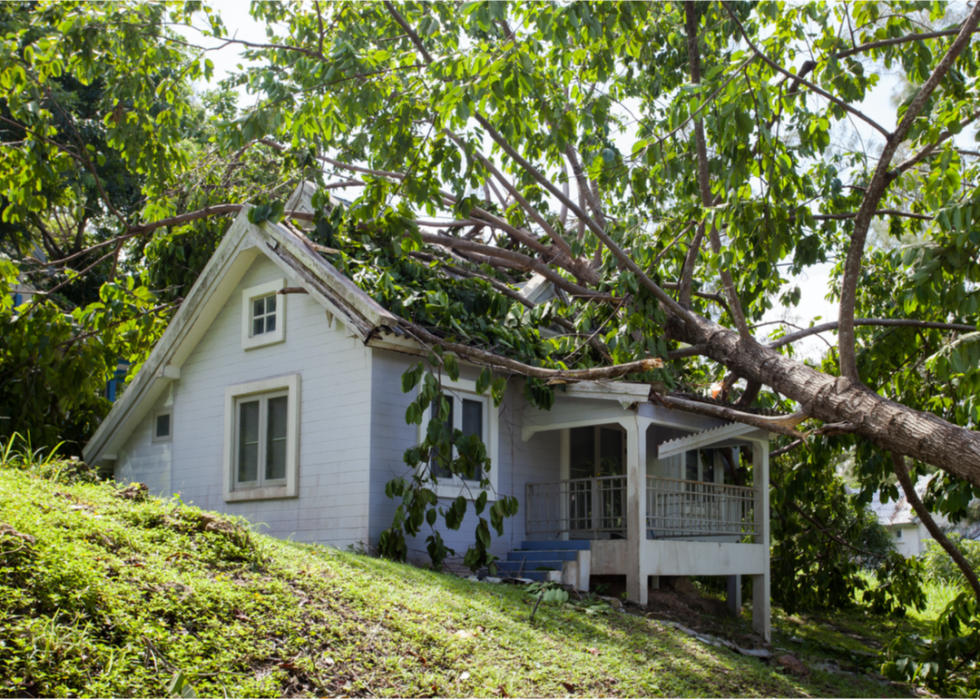
Homes are typically a homeowner’s most valuable asset, and homeowners insurance protects that investment. In 2018 (the most recent data available), 5.7% of homes had an insurance claim, . Types of claims depend greatly on geography and destructive weather like hurricanes and winter storms. Sinkholes, for example, are generally rare across the U.S. but common enough in Florida and Tennessee for those states to mandate homeowners insurance companies to offer coverage. Wildfires, on the other hand, do the most damage in California.
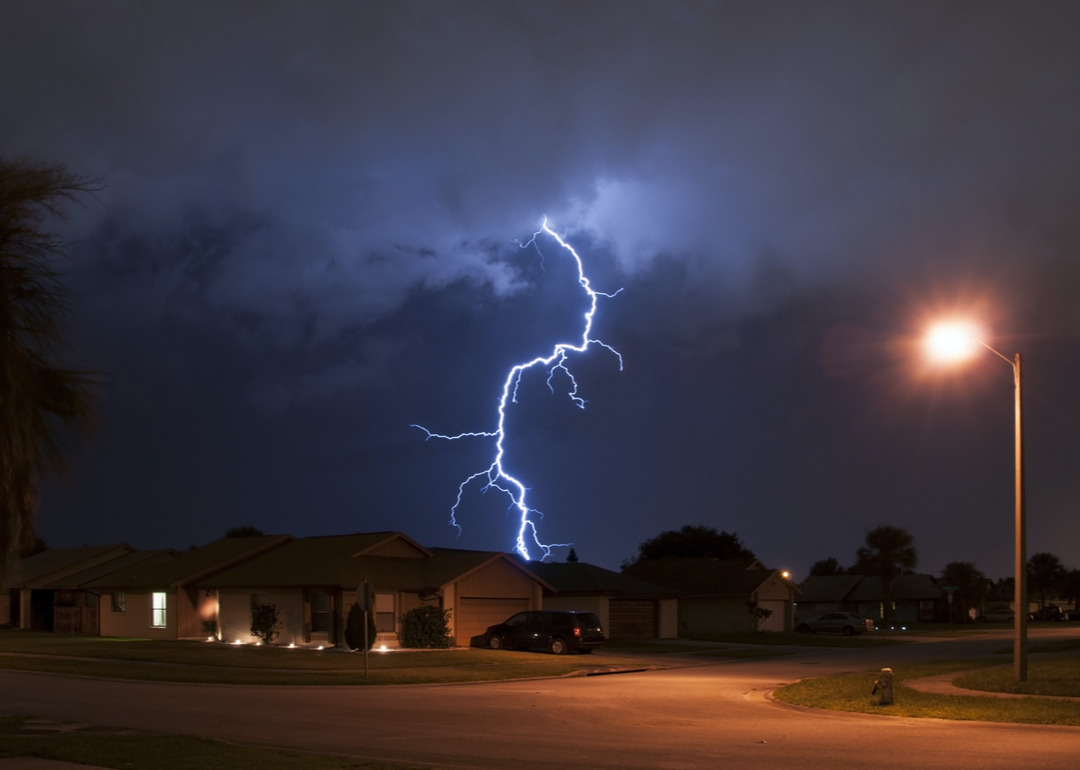
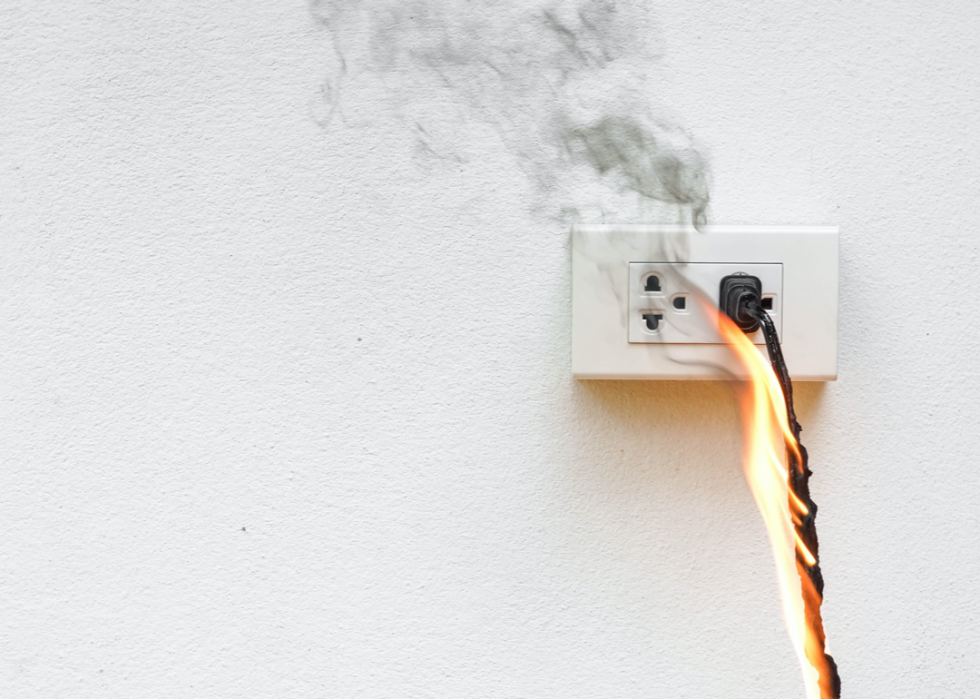
compiled data on homeowners and renter's insurance from the and ranked the most expensive types of homeowner loss claims according to average claim severity, which is a weighted average from 2014–2018. Damage from fire and lightning is widespread across the U.S. and accounts for the costliest homeowner loss claims by a long shot: From 2014–2018, the average claim for damage done by fire and lightning was $79,785. The second most expensive loss claim—bodily injury and property damage—is nearly a third of fire and lightning severity, at $26,872 an average claim, according to the .
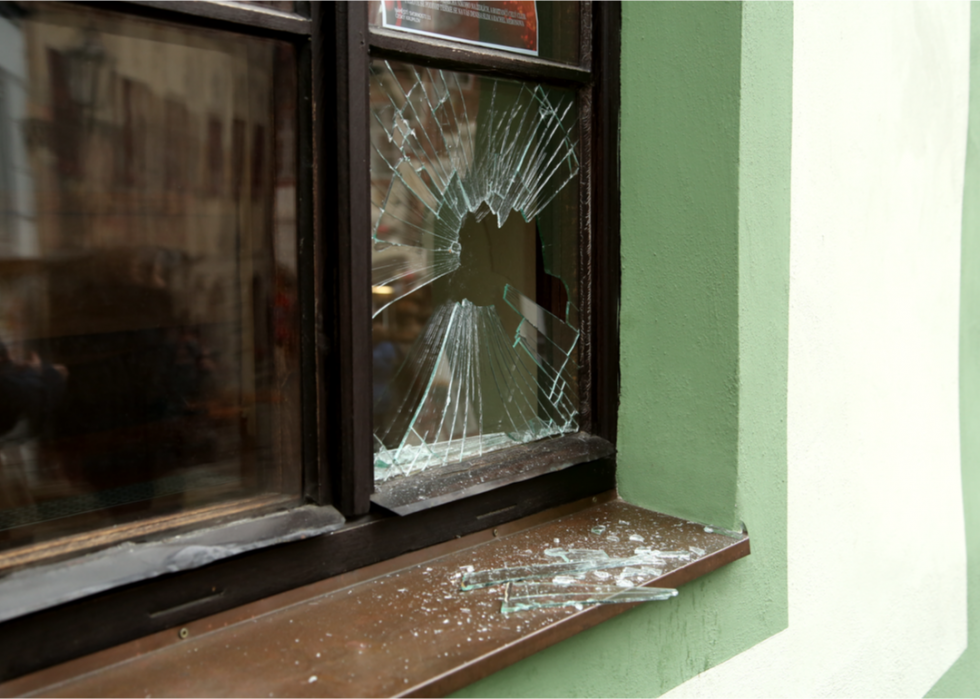
Homeowners insurance covers not just the home itself, but the personal possessions within it. It also covers liability for property damage or injury the homeowner—and the homeowner’s children and pets—cause to others. Flood and earthquake insurance is not covered in standard policies, and is bought separately in places at risk for those natural disasters. Homeowners insurance breaks down into three types of claims: property damage, liability, and credit card and others. Property damage is the leading claim, both by severity and frequency.
Continue reading for the eight most expensive types of homeowners insurance.