50 US metro areas with the dirtiest airโand why they're at risk during COVID-19
50 US metro areas with the dirtiest airโand why they're at risk during COVID-19
A of this year has shown a strong link between places with high levels of air pollution and COVID-19 deaths. The study analyzed 3,080 counties in the United States and found that every increase of 1 ฮผg/m3 of fine particulate matter was associated with an 8% increase in the COVID-19 death rate.
Further evidence has been discovered by looking at the demographics and locations of the people who are suffering the most from the disease. Initially, some pundits and even researchers had the outlook of COVID-19 as the great equalizer, hitting everyone, no matter who they were. But increasing research has found this not to be true. have been hit the hardest by this disease, and these communities often tend to live in areas with higher levels of pollution.
In order to better understand which areas might experience the most harm during COVID-19 in the coming months, ย้ถนิญดด consulted the which was published in 2020 and ranked cities by average fine particulate matter (PM 2.5). Ties were broken by the city with the higher 98th percentile daily fine particulate matter average, and exceptional events were excluded from the dataset to better reflect averages over the year. The for PM 2.5 is 12 ฮผg/m3, a reduction from 15 ฮผg/m3 in 2006. The daily standard for PM 2.5 is 35 ฮผg/m3. The daily standard for PM 10, which is large particulate matter, is 150 ฮผg/m3.
Using this data, ย้ถนิญดด created a list of the 50 U.S. cities with the dirtiest air. Nine of these cities are in California, and three out of the top six are in the Rust Belt, a hub for a lot of the country's industrial agriculture. For these cities, ย้ถนิญดด has included information about where this pollution is coming from and what this might mean as the coronavirus continues to spread.
#50. Tulsa, Oklahoma
- Fine particulate matter (PM2.5) pollution in 2019:
--- Annual average: 9.5 ฮผg/m^3 (20.8% below EPA standard)
--- Daily average (98th percentile): 23 ฮผg/m^3 (34.3% below EPA standard)
- Coarse particulate matter (PM10) pollution in 2019:
--- Annual average: 16 ฮผg/m^3
---Second-highest daily average: 36 ฮผg/m^3 (76.0% below EPA standard)
Oklahoma, after years of making improvements in its air quality, saw a dip in 2019. Tulsa, which starts the list of most polluted U.S. cities, saw that was and one day that was deemed unhealthy for all residents. Some have attributed this change to increased fires. Others, such as Johnson Bridgwater, director of the Oklahoma chapter of the Sierra Club, said that this lower air quality could be a result of President Donald Trump rolling back environmental regulations.
#49. Winston-Salem, North Carolina
- Fine particulate matter (PM2.5) pollution in 2019:
--- Annual average: 9.5 ฮผg/m^3 (20.8% below EPA standard)
--- Daily average (98th percentile): 24 ฮผg/m^3 (31.4% below EPA standard)
- Coarse particulate matter (PM10) pollution in 2019:
--- Annual average: 14 ฮผg/m^3
---Second-highest daily average: 33 ฮผg/m^3 (78.0% below EPA standard)
Winston-Salem has the lowest air quality of any city in the In the state, from transportationโmostly automobiles. As in many places, due to COVID-19 and social distancing measures.
#48. Davenport-Moline-Rock Island, IA-IL
- Fine particulate matter (PM2.5) pollution in 2019:
--- Annual average: 9.6 ฮผg/m^3 (20.0% below EPA standard)
--- Daily average (98th percentile): 24 ฮผg/m^3 (31.4% below EPA standard)
- Coarse particulate matter (PM10) pollution in 2019:
--- Annual average: 35 ฮผg/m^3
---Second-highest daily average: 129 ฮผg/m^3 (14.0% below EPA standard)
Also known as the Quad Cities, Davenport-Moline-Rock Island are located across Iowa and Illinois. In July 2015, the due to smoke from wildfires in Western Canada. Cases of COVID-19 are steadily rising in the Quad Cities, especially in Rock Island County, making the areaโs high levels of pollution that much more dangerous.
#47. Merced, California
- Fine particulate matter (PM2.5) pollution in 2019:
--- Annual average: 9.6 ฮผg/m^3 (20.0% below EPA standard)
--- Daily average (98th percentile): 30 ฮผg/m^3 (14.3% below EPA standard)
- Coarse particulate matter (PM10) pollution in 2019:
--- Annual average: 29 ฮผg/m^3
---Second-highest daily average: 80 ฮผg/m^3 (46.7% below EPA standard)
Merced is the first of nine Californian cities on this list. Located in the center of the state in the San Joaquin Valley, the coming mostly from cars on nearby highways and from railways. In addition, the area is vulnerable to climate change issues, such as wildfires and rising temperatures, which contribute to ozone pollution. So far, Merced has had relatively few coronavirus cases and deathsโ
#46. Weirton-Steubenville, WV-OH
- Fine particulate matter (PM2.5) pollution in 2019:
--- Annual average: 9.6 ฮผg/m^3 (20.0% below EPA standard)
--- Daily average (98th percentile): 39 ฮผg/m^3 (11.4% above EPA standard)
- Coarse particulate matter (PM10) pollution in 2019:
--- Annual average: 16 ฮผg/m^3
---Second-highest daily average: 49 ฮผg/m^3 (67.3% below EPA standard)
The Weirton-Steubenville Metropolitan Area has been dealing with the impacts of air pollution for decades. In fact, in the 1970s, the area's reputation for having the most polluted air in the country made it a , and city data played an important role in EPA regulations on air pollution. Much of the current air pollution in the area comes from . As in much of the country, Ohio Valley, where Weirton-Steubenville is located, is seeing its cases of
#45. Terre Haute, Indiana
- Fine particulate matter (PM2.5) pollution in 2019:
--- Annual average: 9.7 ฮผg/m^3 (19.2% below EPA standard)
--- Daily average (98th percentile): 23 ฮผg/m^3 (34.3% below EPA standard)
- Coarse particulate matter (PM10) pollution in 2019:
--- Annual average: 15 ฮผg/m^3
---Second-highest daily average: 31 ฮผg/m^3 (79.3% below EPA standard)
Although Terre Haute, Indiana is #45 on this list, it has actually made some major improvements in its air quality over the last few years. In 2013, the city did not meet the sulfur dioxide air quality standard. However, in July 2019, after collaborating with the EPA to lower their emissions, Terre Haute Unfortunately, the lower its pollution are now being rolled back, putting it at increased risk.
#44. Brownsville-Harlingen, Texas
- Fine particulate matter (PM2.5) pollution in 2019:
--- Annual average: 9.7 ฮผg/m^3 (19.2% below EPA standard)
--- Daily average (98th percentile): 25 ฮผg/m^3 (28.6% below EPA standard)
Brownsville-Harlingen is located on the southern tip of Texas, along the Mexican border. The areaโs largest city, Brownsville, has one of the in the nation. Over 90% of residents are Hispanic or Latinx. Tens of thousands in the region have pre-existing respiratory conditions such as asthma and COPD, making them especially vulnerable to impacts of COVID-19.
#43. Grants Pass, Oregon
- Fine particulate matter (PM2.5) pollution in 2019:
--- Annual average: 9.7 ฮผg/m^3 (19.2% below EPA standard)
--- Daily average (98th percentile): 30 ฮผg/m^3 (14.3% below EPA standard)
Grants Pass, Oregon, is located in the Rogue Valley, not far north of the California border. Much of the in southern Oregon and neighboring California. Wildfire season in Oregon and California and could create further health problems in combination with the COVID-19 pandemic.
#42. Jackson, Mississippi
- Fine particulate matter (PM2.5) pollution in 2019:
--- Annual average: 9.8 ฮผg/m^3 (18.3% below EPA standard)
--- Daily average (98th percentile): 23 ฮผg/m^3 (34.3% below EPA standard)
- Coarse particulate matter (PM10) pollution in 2019:
--- Annual average: 19 ฮผg/m^3
---Second-highest daily average: 60 ฮผg/m^3 (60.0% below EPA standard)
Jackson is the most populated city in Mississippi. The city is , a demographic that has been hit by the COVID-19 pandemic. Mississippi is one of a number of states reporting , which is due to a number of factors, including the air quality in the places they live.
#41. State College, Pennsylvania
- Fine particulate matter (PM2.5) pollution in 2019:
--- Annual average: 9.8 ฮผg/m^3 (18.3% below EPA standard)
--- Daily average (98th percentile): 25 ฮผg/m^3 (28.6% below EPA standard)
Home to Pennsylvania State University, State College is #41 on this list in spite of its idyllic surroundings. Its air quality has suffered mostly due to vehicle emissions along with agricultural processes. whether the students who attend Penn State will return for classes in the fall, due to the coronavirus.
#40. Yakima, Washington
- Fine particulate matter (PM2.5) pollution in 2019:
--- Annual average: 9.8 ฮผg/m^3 (18.3% below EPA standard)
--- Daily average (98th percentile): 37 ฮผg/m^3 (5.7% above EPA standard)
The air quality of Yakima County in Washington has been over the last few years (2015โ17) and is caused in large part by wildfires in Washington, Oregon, and California. This is especially dangerous in Yakima County, which of coronavirus cases of any county in Washington State as of May 2.
#39. Athens-Clarke County, Georgia
- Fine particulate matter (PM2.5) pollution in 2019:
--- Annual average: 9.9 ฮผg/m^3 (17.5% below EPA standard)
--- Daily average (98th percentile): 21 ฮผg/m^3 (40.0% below EPA standard)
Athens, Georgia, is located roughly 72 miles from Atlanta and shares some of the capitalโs air pollution problems. The main cause is In order to keep air pollution levels as low as possible in the state, an open . This helps keep pollution lower during the summer smog season, which will be especially important as the pandemic continues.
#38. Columbus, Ohio
- Fine particulate matter (PM2.5) pollution in 2019:
--- Annual average: 9.9 ฮผg/m^3 (17.5% below EPA standard)
--- Daily average (98th percentile): 25 ฮผg/m^3 (28.6% below EPA standard)
- Coarse particulate matter (PM10) pollution in 2019:
--- Annual average: 17 ฮผg/m^3
---Second-highest daily average: 39 ฮผg/m^3 (74.0% below EPA standard)
Although Columbus is still 17.5% below the EPA standard, it makes the list as the U.S. city with the 38th-dirtiest air. The city has a population of and has been called a after seeing a 61% rise in confirmed cases in the first week of May. The cityโs elevated levels of air pollution could prove especially harmful as the city sees more cases.
#37. Oklahoma City, Oklahoma
- Fine particulate matter (PM2.5) pollution in 2019:
--- Annual average: 10 ฮผg/m^3 (16.7% below EPA standard)
--- Daily average (98th percentile): 21 ฮผg/m^3 (40.0% below EPA standard)
- Coarse particulate matter (PM10) pollution in 2019:
--- Annual average: 17 ฮผg/m^3
---Second-highest daily average: 63 ฮผg/m^3 (58.0% below EPA standard)
In Oklahoma, have one or more chronic health conditionsโsuch as heart disease, diabetes, and asthmaโthat increase the risk of severe implications from COVID-19. In addition, Oklahoma comes in as the state with the to COVID-19, per a WalletHub study. Although Oklahoma Cityโs air pollution is below the EPA standard, its high levels of pollution could put its population at even higher risk.
#36. Denver-Aurora-Lakewood, Colorado
- Fine particulate matter (PM2.5) pollution in 2019:
--- Annual average: 10 ฮผg/m^3 (16.7% below EPA standard)
--- Daily average (98th percentile): 31 ฮผg/m^3 (11.4% below EPA standard)
- Coarse particulate matter (PM10) pollution in 2019:
--- Annual average: 35 ฮผg/m^3
---Second-highest daily average: 111 ฮผg/m^3 (26.0% below EPA standard)
Colorado's Denver-Aurora-Lakewood Metro Area has experienced high air pollution due in large part to wildfires along with vehicle emissions and the In the state of Colorado, around 404,012 people have asthma, according to the Centers for Disease Control, which to COVID-19.
#35. Philadelphia-Camden-Wilmington, PA-NJ-DE-MD
- Fine particulate matter (PM2.5) pollution in 2019:
--- Annual average: 10.2 ฮผg/m^3 (15.0% below EPA standard)
--- Daily average (98th percentile): 30 ฮผg/m^3 (14.3% below EPA standard)
- Coarse particulate matter (PM10) pollution in 2019:
--- Annual average: 18 ฮผg/m^3
---Second-highest daily average: 49 ฮผg/m^3 (67.3% below EPA standard)
Air pollution measured by metropolitan area is important but can be misleading. Sometimes different neighborhoods in the same city can have very different levels of pollution. Philadelphiaโs metro area, which includes the city itself along with Camden, New Jersey, and Wilmington, Delaware, does not have the same air quality across the entire region. To learn more about this, a are researching pollution in individual neighborhoods throughout Philadelphia. In addition, since the city began to shut down due to the coronavirus, Philadelphia has seen
#34. Warner Robins, Georgia
- Fine particulate matter (PM2.5) pollution in 2019:
--- Annual average: 10.3 ฮผg/m^3 (14.2% below EPA standard)
--- Daily average (98th percentile): 19 ฮผg/m^3 (45.7% below EPA standard)
Warner Robins is home to the , which, in spite of the coronavirus is reopening. This city is also home to the 34th dirtiest air in the country, which could be dangerous for the returning members of the military as well as the rest of the In addition, dozens of personnel on the Air Force Base tested positive for
#33. Little Rock-North Little Rock-Conway, Arkansas
- Fine particulate matter (PM2.5) pollution in 2019:
--- Annual average: 10.3 ฮผg/m^3 (14.2% below EPA standard)
--- Daily average (98th percentile): 23 ฮผg/m^3 (34.3% below EPA standard)
- Coarse particulate matter (PM10) pollution in 2019:
--- Annual average: 19 ฮผg/m^3
---Second-highest daily average: 38 ฮผg/m^3 (74.7% below EPA standard)
Little Rock has a population , of which 41.7% is Black or African American, a high-risk group for COVID-19 complications. Some of this pollution comes from . The Trump administration recently rolled back certain regulations to reduce air pollution. However, the operators of some of these plants are actually opposing the rule because they already invested in pollution-control equipment.
#32. Dayton, Ohio
- Fine particulate matter (PM2.5) pollution in 2019:
--- Annual average: 10.3 ฮผg/m^3 (14.2% below EPA standard)
--- Daily average (98th percentile): 24 ฮผg/m^3 (31.4% below EPA standard)
- Coarse particulate matter (PM10) pollution in 2019:
--- Annual average: 19 ฮผg/m^3
---Second-highest daily average: 54 ฮผg/m^3 (64.0% below EPA standard)
So far, Montgomery County, where Dayton is located, has been weathering the pandemic relatively well. However, as businesses plan to reopen, a the county as a potential coronavirus hotspot despite the number of reported cases. This could prove especially risky for Dayton residents, where air pollutionโwhile below the EPA standardsโis still the 32nd-highest in the U.S.
#31. Springfield, Ohio
- Fine particulate matter (PM2.5) pollution in 2019:
--- Annual average: 10.4 ฮผg/m^3 (13.3% below EPA standard)
--- Daily average (98th percentile): 23 ฮผg/m^3 (34.3% below EPA standard)
Springfield is less than 30 miles from Dayton and shares some of its pollution problems. In fact, , blamed their high ozone levels on downwind emissions from Dayton as well as from nearby highways. "We're not blaming all of it on that, but if Springfield was two counties away from Dayton surrounded by rural areas, our numbers would be much better," Patterson told the Springfield News-Sun's Michael Cooper in 2017.
#30. St. Louis, MO-IL
- Fine particulate matter (PM2.5) pollution in 2019:
--- Annual average: 10.5 ฮผg/m^3 (12.5% below EPA standard)
--- Daily average (98th percentile): 30 ฮผg/m^3 (14.3% below EPA standard)
- Coarse particulate matter (PM10) pollution in 2019:
--- Annual average: 35 ฮผg/m^3
---Second-highest daily average: 99 ฮผg/m^3 (34.0% below EPA standard)
Residents of the St. Louis area have reason to be concerned about its low air quality during the COVID-19 pandemic. According to Eli Chen of , Mamie Causey, a 79-year-old resident, said, โI live in fear on a daily basis, if you really want to know the truth. [The pollution] impacts your breathing on a daily basis.โ In addition, a nearby for possible air poisoning from heavy metals in Nov. 2019.
#29. Klamath Falls, Oregon
- Fine particulate matter (PM2.5) pollution in 2019:
--- Annual average: 10.5 ฮผg/m^3 (12.5% below EPA standard)
--- Daily average (98th percentile): 34 ฮผg/m^3 (2.9% below EPA standard)
- Coarse particulate matter (PM10) pollution in 2019:
--- Annual average: 20 ฮผg/m^3
---Second-highest daily average: 58 ฮผg/m^3 (61.3% below EPA standard)
Although Klamath Fallsโ fine particulate matter numbers are still below the EPA standard, the region has high levels compared to the rest of the United States, due in large part to fires. One researcher, , is spearheading a project to monitor that pollution in order to reduce it. She is also working on a solar-powered monitoring station, so that the monitoring itself is not contributing to further emissions.
#28. Birmingham-Hoover, Alabama
- Fine particulate matter (PM2.5) pollution in 2019:
--- Annual average: 10.6 ฮผg/m^3 (11.7% below EPA standard)
--- Daily average (98th percentile): 21 ฮผg/m^3 (40.0% below EPA standard)
- Coarse particulate matter (PM10) pollution in 2019:
--- Annual average: 23 ฮผg/m^3
---Second-highest daily average: 80 ฮผg/m^3 (46.7% below EPA standard)
Of Birminghamโs population of is African American, a group experiencing disproportionately This is likely compounded by the cityโs high level of air pollution and is especially dangerous as Montgomery County, where Birmingham is located, is emerging as a
#27. Louisville/Jefferson County, KY-IN
- Fine particulate matter (PM2.5) pollution in 2019:
--- Annual average: 10.6 ฮผg/m^3 (11.7% below EPA standard)
--- Daily average (98th percentile): 23 ฮผg/m^3 (34.3% below EPA standard)
After a coal-fired power plant closed in Louisville in 2015, 400 fewer hospital visits and a 55% reduction in lung-irritating pollutants. Although the city still has dirty air, the research made it clear that lowering pollution is beneficial to human health. This could be helpful to the residents of the city during this pandemic. However, the , so the amount of pollution in the air could get even higher.
#26. Modesto, California
- Fine particulate matter (PM2.5) pollution in 2019:
--- Annual average: 10.6 ฮผg/m^3 (11.7% below EPA standard)
--- Daily average (98th percentile): 36 ฮผg/m^3 (2.9% above EPA standard)
- Coarse particulate matter (PM10) pollution in 2019:
--- Annual average: 30 ฮผg/m^3
---Second-highest daily average: 104 ฮผg/m^3 (30.7% below EPA standard)
Modesto is one of nine cities on this list located in California, highlighting the fact that the Golden State has problems with air pollution. This increase in air pollution in Modesto and around the country vehicle emissions, increases in wildfires, and relaxation of environmental regulations. Stanislaus County, where Modesto is located, lifted its stay-at-home order May 12, even though it does not meet
#25. Houston-The Woodlands-Sugar Land, Texas
- Fine particulate matter (PM2.5) pollution in 2019:
--- Annual average: 10.7 ฮผg/m^3 (10.8% below EPA standard)
--- Daily average (98th percentile): 20 ฮผg/m^3 (42.9% below EPA standard)
- Coarse particulate matter (PM10) pollution in 2019:
--- Annual average: 29 ฮผg/m^3
---Second-highest daily average: 63 ฮผg/m^3 (58.0% below EPA standard)
Like many places with elevated levels of air pollution, residents of the Houston Metropolitan Area suffer from cardiovascular diseases such as asthma. Last year, the Houston Independent School District , saying that itโs the biggest chronic disease they face. While this puts residents at higher risk for COVID-19 complications, the good news is that Houston is currently doing especially well when it comes to keeping their
#24. Augusta-Richmond County, GA-SC
- Fine particulate matter (PM2.5) pollution in 2019:
--- Annual average: 10.7 ฮผg/m^3 (10.8% below EPA standard)
--- Daily average (98th percentile): 22 ฮผg/m^3 (37.1% below EPA standard)
- Coarse particulate matter (PM10) pollution in 2019:
--- Annual average: 12 ฮผg/m^3
---Second-highest daily average: 25 ฮผg/m^3 (83.3% below EPA standard)
Augusta-Richmond has a population of nearly of fine particulate matter in the area only 10.8% below the EPAโs limit. Residents in this city are at increased risk of having serious complications if they contract the COVID-19 disease, which is all the more important now, as Georgia has been one of the first states to reopen, a move in infections, especially in highly populated urban areas like Augusta.
#23. Albany, Georgia
- Fine particulate matter (PM2.5) pollution in 2019:
--- Annual average: 10.7 ฮผg/m^3 (10.8% below EPA standard)
--- Daily average (98th percentile): 27 ฮผg/m^3 (22.9% below EPA standard)
Albany, , faces many of the same problems as Augusta. Its fine particulate matter pollution was also only 10.8% lower than the EPA standard in 2019, and its residents must also deal with the consequences of the state reopening.
#22. Laredo, Texas
- Fine particulate matter (PM2.5) pollution in 2019:
--- Annual average: 10.7 ฮผg/m^3 (10.8% below EPA standard)
--- Daily average (98th percentile): 29 ฮผg/m^3 (17.1% below EPA standard)
- Coarse particulate matter (PM10) pollution in 2019:
--- Annual average: 25 ฮผg/m^3
---Second-highest daily average: 48 ฮผg/m^3 (68.0% below EPA standard)
The city of Laredo is located along the Texas Gulf Coast and experiences high levels of air pollution due to emissions from nearby oil refineries and chemical plants. Laredo is part of the United Statesโ petrochemical corridor. Four of the 10 largest oil and gas refineries in the country are located in this region. Unfortunately, even though the country is in the middle of a pandemic that hits people in polluted areas the hardest, the Trump administration has actually rolled back regulations that would lower air pollution.
#21. McAllen-Edinburg-Mission, Texas
- Fine particulate matter (PM2.5) pollution in 2019:
--- Annual average: 10.7 ฮผg/m^3 (10.8% below EPA standard)
--- Daily average (98th percentile): 30 ฮผg/m^3 (14.3% below EPA standard)
- Coarse particulate matter (PM10) pollution in 2019:
--- Annual average: 24 ฮผg/m^3
---Second-highest daily average: 50 ฮผg/m^3 (66.7% below EPA standard)
The McAllen-Edinburg-Mission area is located in the Rio Grande Valley. On April 13, AirNow.gov deemed the air quality This is especially worrying as Texas is in the midst of the coronavirus pandemic and these sensitive groups were put at even higher risk due to the pollution.
#20. Atlanta-Sandy Springs-Roswell, Georgia
- Fine particulate matter (PM2.5) pollution in 2019:
--- Annual average: 10.8 ฮผg/m^3 (10.0% below EPA standard)
--- Daily average (98th percentile): 24 ฮผg/m^3 (31.4% below EPA standard)
- Coarse particulate matter (PM10) pollution in 2019:
--- Annual average: 17 ฮผg/m^3
---Second-highest daily average: 40 ฮผg/m^3 (73.3% below EPA standard)
Residents of the Atlanta metropolitan area experience both The smog comes mostly from cars while the soot comes from diesel emissions, coal-fired power plants, wildfires and wood-burning devices. Unlike in many other cities, Atlanta has so far in air pollution during the coronavirus lockdown.
#19. El Centro, California
- Fine particulate matter (PM2.5) pollution in 2019:
--- Annual average: 10.8 ฮผg/m^3 (10.0% below EPA standard)
--- Daily average (98th percentile): 27 ฮผg/m^3 (22.9% below EPA standard)
- Coarse particulate matter (PM10) pollution in 2019:
--- Annual average: 44 ฮผg/m^3
---Second-highest daily average: 162 ฮผg/m^3 (8.0% above EPA standard)
The Imperial Valley, where El Centro is located, is known for having This is playing out in a deadly fashion during the coronavirus pandemic. El Centro is the county seat of Imperial County, which has the of coronavirus hospitalizations in California as of May 13. This is being attributed in part at least to the air quality. Residents in the area have rates of tuberculosis eight times higher than the United States average.
#18. Chicago-Naperville-Elgin, IL-IN-WI
- Fine particulate matter (PM2.5) pollution in 2019:
--- Annual average: 10.8 ฮผg/m^3 (10.0% below EPA standard)
--- Daily average (98th percentile): 28 ฮผg/m^3 (20.0% below EPA standard)
- Coarse particulate matter (PM10) pollution in 2019:
--- Annual average: 19 ฮผg/m^3
---Second-highest daily average: 69 ฮผg/m^3 (54.0% below EPA standard)
The Chicago Metropolitan Area is made up of a number of different neighborhoods with varying income levels and demographics. Chicagoโs southside, an area African American, also experiences high levels of air pollution. In Southeast Chicago, 75 companies have been investigated for . In addition, unlike in other cities, in Chicago since lockdown.
#17. Shreveport-Bossier City, Louisiana
- Fine particulate matter (PM2.5) pollution in 2019:
--- Annual average: 10.9 ฮผg/m^3 (9.2% below EPA standard)
--- Daily average (98th percentile): 23 ฮผg/m^3 (34.3% below EPA standard)
Shreveport-Bossier Cityโs daily average of fine particulate matter in 2019 was only 9.2% below the EPA standard. However, there is some good news coming out of the area, which is that Shreveport ranks among the United Statesโ best cities for per a
#16. Cleveland-Elyria, Ohio
- Fine particulate matter (PM2.5) pollution in 2019:
--- Annual average: 10.9 ฮผg/m^3 (9.2% below EPA standard)
--- Daily average (98th percentile): 27 ฮผg/m^3 (22.9% below EPA standard)
- Coarse particulate matter (PM10) pollution in 2019:
--- Annual average: 31 ฮผg/m^3
---Second-highest daily average: 79 ฮผg/m^3 (47.3% below EPA standard)
As the 16th-worst metropolitan area for air pollution in the United States, residents in the Cleveland area are at . The one bright spot is that, like in many places due to social distancing and quarantine measures, down in the Cleveland area.
#15. New York-Newark-Jersey City, NY-NJ-PA
- Fine particulate matter (PM2.5) pollution in 2019:
--- Annual average: 11 ฮผg/m^3 (8.3% below EPA standard)
--- Daily average (98th percentile): 26 ฮผg/m^3 (25.7% below EPA standard)
- Coarse particulate matter (PM10) pollution in 2019:
--- Annual average: 15 ฮผg/m^3
---Second-highest daily average: 34 ฮผg/m^3 (77.3% below EPA standard)
The New York City Metro Area has become the United Statesโ epicenter of the COVID-19 pandemic. New York City alone, excluding Newark and Jersey City, has already seen as of May 15. And areas of the city with the highest populations of communities of colorโneighborhoods that also tend to have higher levels of pollutionโhave The one small bright spot is that like many other large cities, pollution levels have since quarantine measures began.
#14. Harrisburg-Carlisle, Pennsylvania
- Fine particulate matter (PM2.5) pollution in 2019:
--- Annual average: 11 ฮผg/m^3 (8.3% below EPA standard)
--- Daily average (98th percentile): 34 ฮผg/m^3 (2.9% below EPA standard)
A report by the PennEnvironment Research & Policy Center , some communities in the Harrisburg-Carlisle area breathed dirty air for at least half the year. The particulate pollution responsible for the regionโs dirty air often comes from
#13. Lancaster, Pennsylvania
- Fine particulate matter (PM2.5) pollution in 2019:
--- Annual average: 11 ฮผg/m^3 (8.3% below EPA standard)
--- Daily average (98th percentile): 36 ฮผg/m^3 (2.9% above EPA standard)
- Coarse particulate matter (PM10) pollution in 2019:
--- Annual average: 16 ฮผg/m^3
---Second-highest daily average: 51 ฮผg/m^3 (66.0% below EPA standard)
Although Lancasterโs annual average for fine particulate matter in the air was 8.3% below the EPA standard in 2019, its daily average was actually 2.9% above the standard, the first city on this list to reach that milestone. This is especially dangerous for residents of Lancaster if they contract COVID-19, which might be more likely now as Lancaster County plans to begin the next stage of reopening on May 15 even though it has not gotten
#12. Fresno, California
- Fine particulate matter (PM2.5) pollution in 2019:
--- Annual average: 11.2 ฮผg/m^3 (6.7% below EPA standard)
--- Daily average (98th percentile): 37 ฮผg/m^3 (5.7% above EPA standard)
- Coarse particulate matter (PM10) pollution in 2019:
--- Annual average: 39 ฮผg/m^3
---Second-highest daily average: 234 ฮผg/m^3 (56.0% above EPA standard)
Fresnoโs daily average of fine particulate matter in the air was 5.7% above the EPA standard in 2019. In addition, the people who are most impacted by this pollution tend to be poorer, who are suffering financial difficulties due to COVID-19-related job losses. Although air pollution is dipping due to social distancing and quarantine measures, it is still a small reduction and might be temporary.
#11. Phoenix-Mesa-Scottsdale, Arizona
- Fine particulate matter (PM2.5) pollution in 2019:
--- Annual average: 11.3 ฮผg/m^3 (5.8% below EPA standard)
--- Daily average (98th percentile): 33 ฮผg/m^3 (5.7% below EPA standard)
- Coarse particulate matter (PM10) pollution in 2019:
--- Annual average: 59 ฮผg/m^3
---Second-highest daily average: 222 ฮผg/m^3 (48.0% above EPA standard)
The Phoenix Metro Area is currently experiencing its . This is especially problematic now that the novel coronavirus has hit and has worse ramifications in areas with bad pollution. Rollbacks of EPA regulations by the Trump administration won't help the matter and will likely contribute to higher levels of pollution in the region in the coming years.
#10. Cincinnati, OH-KY-IN
- Fine particulate matter (PM2.5) pollution in 2019:
--- Annual average: 11.9 ฮผg/m^3 (0.8% below EPA standard)
--- Daily average (98th percentile): 26 ฮผg/m^3 (25.7% below EPA standard)
- Coarse particulate matter (PM10) pollution in 2019:
--- Annual average: 20 ฮผg/m^3
---Second-highest daily average: 45 ฮผg/m^3 (70.0% below EPA standard)
Cincinnatiโs annual average of soot in the air is 0.8% below EPA standard, just barely making the cut. However, although the city is technically in adherence with the EPAโs recently lowered standards, it still has very dirty air, a problem for its residents. This danger could become more stark as businesses in Cincinnati begin to reopen, even as its
#9. Hanford-Corcoran, California
- Fine particulate matter (PM2.5) pollution in 2019:
--- Annual average: 12.3 ฮผg/m^3 (2.5% above EPA standard)
--- Daily average (98th percentile): 47 ฮผg/m^3 (34.3% above EPA standard)
- Coarse particulate matter (PM10) pollution in 2019:
--- Annual average: 49 ฮผg/m^3
---Second-highest daily average: 304 ฮผg/m^3 (102.7% above EPA standard)
Hanford is located in Californiaโs San Joaquin Valley and is the first city on this list with an annual average of fine particulate matter above the EPA standard. And its 98th percentile daily average is actually 34.3% above the standard. This is bad news for its residents and the people who work in Hanford, who are at higher risk due to their low air quality. A meat processor in Hanford already had nearly on May 13.
#8. Fairbanks, Alaska
- Fine particulate matter (PM2.5) pollution in 2019:
--- Annual average: 12.3 ฮผg/m^3 (2.5% above EPA standard)
--- Daily average (98th percentile): 64 ฮผg/m^3 (82.9% above EPA standard)
- Coarse particulate matter (PM10) pollution in 2019:
--- Annual average: 19 ฮผg/m^3
---Second-highest daily average: 200 ฮผg/m^3 (33.3% above EPA standard)
Fairbanks has some of the worst air in the United States. Its 98th percentile daily average for fine particulate matter is 82.9% above EPA limits. Luckily for the residents there, when it comes to coronavirus, there are so far only across the entire state of Alaska, with 10 deaths as of May 15.
#7. Indianapolis-Carmel-Anderson, Indiana
- Fine particulate matter (PM2.5) pollution in 2019:
--- Annual average: 12.5 ฮผg/m^3 (4.2% above EPA standard)
--- Daily average (98th percentile): 28 ฮผg/m^3 (20.0% below EPA standard)
- Coarse particulate matter (PM10) pollution in 2019:
--- Annual average: 26 ฮผg/m^3
---Second-highest daily average: 57 ฮผg/m^3 (62.0% below EPA standard)
The Indianapolis Metro Area had an annual average of fine particulate matter pollution that was 4.2% above the EPA standard. However, since the pandemic and associated social distancing measures began, Indianapolis has seen a r. Since air pollution is associated with higher levels of COVID-19 death, hopefully this will make residents of the city safer.
#6. Detroit-Warren-Dearborn, Michigan
- Fine particulate matter (PM2.5) pollution in 2019:
--- Annual average: 12.6 ฮผg/m^3 (5.0% above EPA standard)
--- Daily average (98th percentile): 31 ฮผg/m^3 (11.4% below EPA standard)
- Coarse particulate matter (PM10) pollution in 2019:
--- Annual average: 25 ฮผg/m^3
---Second-highest daily average: 65 ฮผg/m^3 (56.7% below EPA standard)
Detroit and its surrounding cities have experienced an especially high number of COVID-19 deaths. Its death rate of is more than 250% higher than the Michigan average. It's not a coincidence that this region also has the sixth-worst air in the country. On a slightly positive note,
#5. Visalia-Porterville, California
- Fine particulate matter (PM2.5) pollution in 2019:
--- Annual average: 12.9 ฮผg/m^3 (7.5% above EPA standard)
--- Daily average (98th percentile): 46 ฮผg/m^3 (31.4% above EPA standard)
- Coarse particulate matter (PM10) pollution in 2019:
--- Annual average: 46 ฮผg/m^3
---Second-highest daily average: 284 ฮผg/m^3 (89.3% above EPA standard)
Beginning the top five cities with the dirtiest air is Visalia-Porterville, which in 2019 had an annual average of fine particulate matter that was 7.5% above the EPA standard. Some of this pollution comes from Unfortunately for residents in Visalia-Porterville, wildfire season is near, which could make their experience with COVID-19 even worse.
#4. Bakersfield, California
- Fine particulate matter (PM2.5) pollution in 2019:
--- Annual average: 13 ฮผg/m^3 (8.3% above EPA standard)
--- Daily average (98th percentile): 47 ฮผg/m^3 (34.3% above EPA standard)
- Coarse particulate matter (PM10) pollution in 2019:
--- Annual average: 54 ฮผg/m^3
---Second-highest daily average: 382 ฮผg/m^3 (154.7% above EPA standard)
Bakersfield is located in Californiaโs Central Valley and it is , contributing to its heavily polluted air. Its locationโsurrounded by mountainsโtraps pollutants, which come , such as heavy truck traffic, diesel-burning trains, agriculture, and wood-burning stoves and fireplaces.
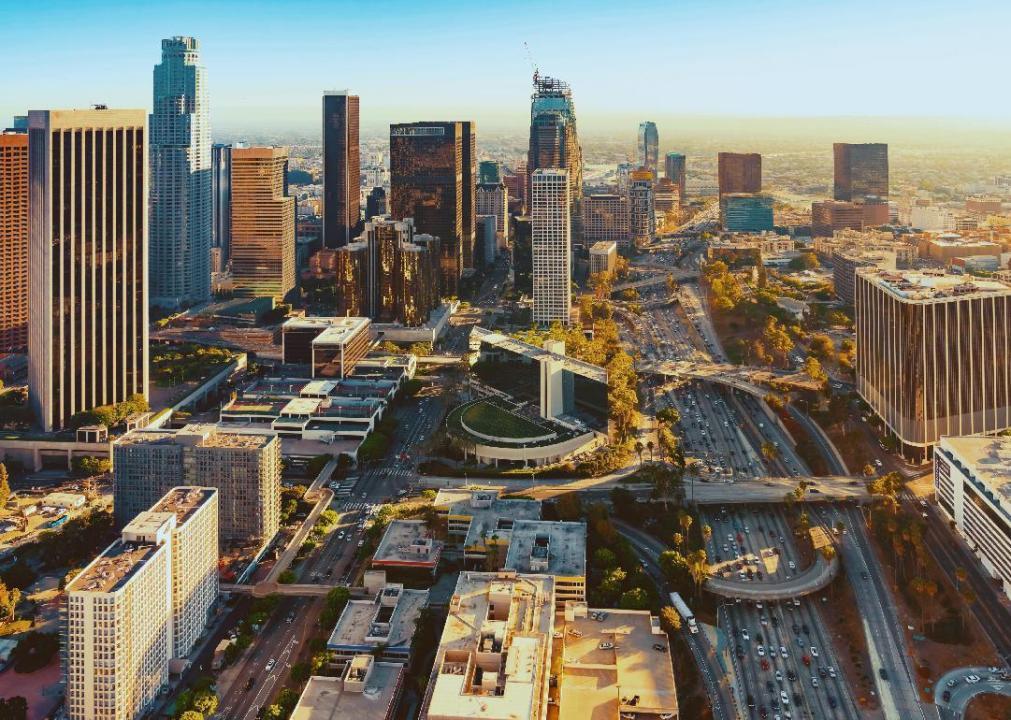
#3. Los Angeles-Long Beach-Anaheim, California
- Fine particulate matter (PM2.5) pollution in 2019:
--- Annual average: 13.4 ฮผg/m^3 (11.7% above EPA standard)
--- Daily average (98th percentile): 30 ฮผg/m^3 (14.3% below EPA standard)
- Coarse particulate matter (PM10) pollution in 2019:
--- Annual average: 28 ฮผg/m^3
---Second-highest daily average: 159 ฮผg/m^3 (6.0% above EPA standard)
The Los Angeles Metropolitan Area is known for its smog, which can be seen from its 2019 EPA data. However, the current pandemic has caused L.A. to have some of the The city is still one of the crisis in the United States, and pre-existing health problems caused by past air pollution could be dangerous for many residents.
#2. Pittsburgh, Pennsylvania
- Fine particulate matter (PM2.5) pollution in 2019:
--- Annual average: 14.2 ฮผg/m^3 (18.3% above EPA standard)
--- Daily average (98th percentile): 65 ฮผg/m^3 (85.7% above EPA standard)
- Coarse particulate matter (PM10) pollution in 2019:
--- Annual average: 23 ฮผg/m^3
---Second-highest daily average: 86 ฮผg/m^3 (42.7% below EPA standard)
Pittsburghโs daily average of fine particulate matter is 85.7% above the EPA standard. The majority of the industrial air pollution in Allegheny County, where the city is located, , which are responsible for 83% of the pollution. Regulatory rollbacks by the Trump administration are not likely to improve this predicament.
#1. Riverside-San Bernardino-Ontario, California
- Fine particulate matter (PM2.5) pollution in 2019:
--- Annual average: 15.4 ฮผg/m^3 (28.3% above EPA standard)
--- Daily average (98th percentile): 36 ฮผg/m^3 (2.9% above EPA standard)
- Coarse particulate matter (PM10) pollution in 2019:
--- Annual average: 46 ฮผg/m^3
---Second-highest daily average: 139 ฮผg/m^3 (7.3% below EPA standard)
Topping the list is the Riverside Metropolitan Area with its annual average of fine particulate matter at 28.3% above the EPA standard in 2019. This is especially unfortunate for its residents, as the county voted to


